
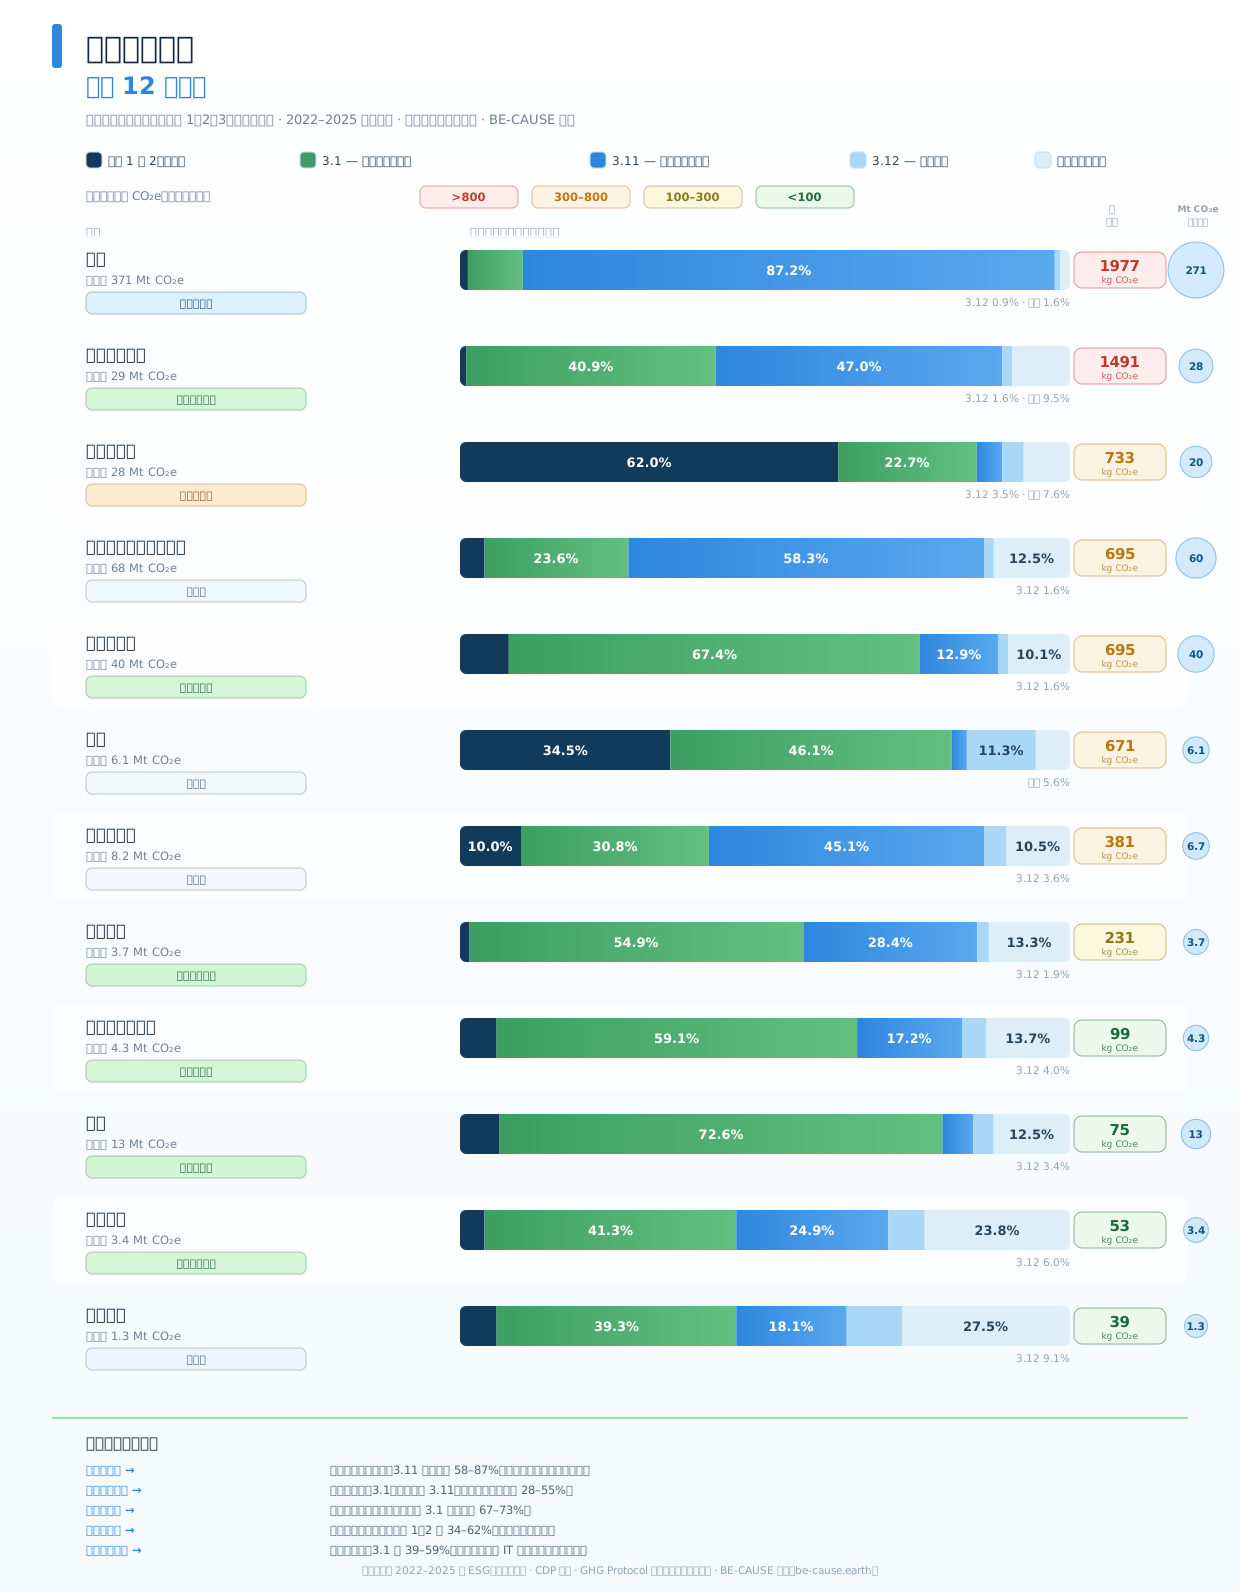
By Emmanuel Delplanque, Co-Founder & CEO of BE-CAUSE. Two questions decide whether a decarbonisation programme succeeds or wastes three years: where does my carbon actually sit, and who inside my company controls it? We answered them at industry level. This benchmark maps the average carbon architecture of twelve industries — automotive, cosmetics and personal care, chemicals and materials, electronics/semiconductors/automation, food and beverage, packaging, manufacturing and industry, fashion, medical devices and pharma, retail, digital marketing and intellectual services — using reported Scopes 1, 2 and 3 data from the leading companies by revenue in each sector.
Read the chart horizontally and you see the shape of a business model. Read it vertically and you see something else: two companies of identical revenue can differ by a factor of fifty in carbon intensity. Both readings matter, and they lead to very different action plans.
The one-line summary: Scope 3 is not one problem, it is five different problems
The GHG Protocol defines fifteen Scope 3 categories, but in practice almost all the tonnage concentrates in three: Category 3.1 (purchased goods and services), Category 3.11 (use of sold products) and Category 3.12 (end-of-life treatment of sold products). The relative weight of these three, plus the residual weight of Scopes 1 and 2, produces five recurring profiles across the twelve industries we analysed.
| Profile | Signature | Industries | Who owns the lever |
|---|---|---|---|
| Downstream giant | Cat. 3.11 above 55% of the total footprint | Automotive, Electronics / Semi / Automation | R&D and product strategy |
| Upstream heavyweight | Cat. 3.1 above 55% of the total footprint | Food & Beverage, Retail, Medical Devices / Pharma | Procurement and supplier engagement |
| Balanced equation | Cat. 3.1 and Cat. 3.11 both between 25% and 55% | Cosmetics & Personal Care, Fashion, Digital Marketing | Procurement plus product design and marketing |
| Direct emitter | Scopes 1 + 2 above 30% of the total footprint | Chemical & Materials, Packaging | Operations, energy and process engineering |
| Mixed profile | No category above 50%; long tail in other Scope 3 | Manufacturing & Industry, Intellectual Services, Packaging | Cross-functional, starting with data |
Profile 1 — Downstream giants: automotive and electronics
Automotive is the extreme case: on average, 87% of the total corporate footprint occurs after the vehicle is sold, in Category 3.11. Electronics, semiconductors and industrial automation follow the same logic at 58%, driven by the electricity a device or machine draws over its service life. For these industries, no supplier programme can compensate for a product that consumes energy for ten to fifteen years. The lever is product design: efficiency, electrification, and the energy mix in the markets where the product is used.
The trap is that this dominance is temporary. As electrification and efficiency remove the use-phase emissions, the footprint does not disappear — it migrates upstream into Category 3.1: cells, wafers, aluminium, copper, rare earths, steel. An electric vehicle carries roughly 40% to 60% more manufacturing carbon than its combustion equivalent, most of it in the battery. Automotive and electronics procurement teams are in a grace period, and the cliff arrives with the first CSRD-audited Scope 3 disclosure that regulators actually check.
“Electrification does not delete carbon. It relocates it — from the road to the mine, the smelter and the cell plant.”
— BE-CAUSE
Profile 2 — Upstream heavyweights: food & beverage, retail, medical devices and pharma
Food and beverage (67% in Category 3.1), retail (73%) and medical devices and pharma (59%) share one characteristic: the company sells something it did not physically make. The carbon was emitted in a field, a fermentation tank, a contract manufacturing site or a Tier-2 chemical plant, usually thousands of kilometres away and often two or three tiers deep in the supply chain.
For these industries, the decarbonisation programme is a procurement programme. And that is where the data problem becomes acute: the emission factors published in commercial databases are averages that cannot detect the difference between a well-run and a poorly-run supplier. If 70% of your footprint sits in Category 3.1 and 100% of your Category 3.1 data is spend-based, you are not measuring your footprint — you are measuring your purchase orders.
Profile 3 — The balanced equation: cosmetics, fashion, digital marketing
Cosmetics and personal care split roughly 41% upstream and 47% downstream. Fashion sits at 55% upstream and 28% downstream. Digital marketing splits between purchased services (41%), the energy of the devices and infrastructure that deliver the content (25%) and a long tail of travel, cloud and data (24%).
These are the hardest programmes to govern, because no single function owns even half the problem. A shampoo's downstream footprint depends on how long the consumer keeps the water hot; a garment's depends on washing temperature and how many times it is worn before disposal. Procurement can decarbonise the ingredients and fabrics, but only product design and marketing can change the use pattern. Success here requires a governance body, not a project owner.
Profile 4 — Direct emitters: chemicals, materials and packaging
Chemicals and materials is the outlier of the benchmark: 62% of the total footprint sits in Scopes 1 and 2, inside the company's own boundary. Packaging follows at 35%. These industries burn heat, run electrolysis and generate process emissions that no supplier engagement programme can touch.
The good news is that direct emissions are controllable, measurable and financeable. The bad news is that they are capital-intensive — electric crackers, heat pumps, green hydrogen, carbon capture — with payback horizons that exceed most CFO planning cycles. This is precisely the profile that benefits from green finance instruments: in China, the PBOC Carbon Emission Reduction Support Tool and Green Factory certification now channel preferential capital to exactly these projects.
Profile 5 — Mixed profiles: manufacturing, industry and services
Manufacturing and industry (31% upstream, 45% downstream, 10% direct) and intellectual services (39% upstream, 18% downstream, 28% in other categories) have no dominant category. For diversified industrial groups the answer is to stop reasoning at group level and run the analysis by business unit — a group average hides three different profiles inside the same legal entity. For services firms the carbon sits in an unglamorous long tail: cloud and IT infrastructure, business travel, professional services, employee commuting.
The second reading: carbon intensity per unit of revenue
Absolute tonnage tells you who is large. Carbon intensity — kilograms of CO₂e per thousand US dollars of revenue — tells you who is exposed. This is the number that determines your cost under a carbon price, your CBAM bill at the EU border, and the risk premium a lender or insurer applies to your business.
| Industry | Carbon intensity (kg CO₂e / USD k revenue) | Dominant category | Exposure band |
|---|---|---|---|
| Automotive | ~1 977 | 3.11 — use of sold products | Very high |
| Cosmetics & Personal Care | ~1 491 | 3.11 then 3.1 | Very high |
| Chemical & Materials | ~733 | Scopes 1 & 2 | High |
| Electronics / Semi / Automation | ~695 | 3.11 — use of sold products | High |
| Food & Beverage | ~695 | 3.1 — purchased goods | High |
| Packaging | ~671 | 3.1 then Scopes 1 & 2 | High |
| Manufacturing & Industry | ~381 | 3.11 then 3.1 | High |
| Fashion | ~231 | 3.1 — purchased goods | Moderate |
| Medical Devices / Pharma | ~99 | 3.1 — purchased goods | Low |
| Retail | ~75 | 3.1 — purchased goods | Low |
| Digital Marketing | ~53 | 3.1 and other categories | Low |
| Intellectual Services | ~39 | 3.1 and other categories | Low |
The spread is the story: automotive is roughly fifty times more carbon-intensive per dollar of revenue than intellectual services. That gap explains why a single carbon-price scenario applied across a diversified portfolio is meaningless, and why a supplier ESG questionnaire designed for a chemical plant is useless when sent to a design agency.
What this means if you are a buyer sourcing from Asia
Use the benchmark to prioritise, not to report. If your industry sits in the upstream-heavyweight or balanced profiles, the majority of your footprint is inside factories you do not own — and, for most European and North American listed companies, a large share of those factories are in China, Vietnam, India or Bangladesh. CSRD and CSDDD will require you to demonstrate that you know who they are and what they emit. Spend-based estimates satisfy a spreadsheet; they do not satisfy an auditor, and they never reduce a tonne.
- Rank your suppliers by estimated Category 3.1 contribution, not by spend — the two lists are rarely the same.
- Collect primary energy and production data from the top 20 contributors before buying another database licence.
- Map Tier 2 for the materials that dominate your bill of materials: fabric mills, cell plants, foundries, ingredient producers.
- Set supplier targets that match their maturity, not your reporting deadline — an unprepared supplier returns unusable data.
What this means if you are a supplier receiving carbon requests
If you manufacture in China or elsewhere in Asia and your customers have started sending CDP questionnaires, EcoVadis assessments or Scope 3 data requests, this benchmark tells you why. Your customer's Category 3.1 is your Scopes 1 and 2. Their regulatory deadline has become your commercial requirement, and the request will not go away — it will be repeated annually, by more customers, with more precision.
The suppliers that treat the first request as an administrative burden lose the account within two or three cycles. The ones that build a simple, verifiable energy and production dataset become the preferred partner of buyers who are desperate for primary data. In an industry where 70% of purchased-goods emissions are still estimated from averages, being measurable is a commercial advantage before it is a compliance obligation.
How to read your own carbon architecture in four steps
- Step 1 — Locate your industry in the chart and note the dominant category. That is your hypothesis, not your answer.
- Step 2 — Run a screening Scope 3 estimate across all fifteen categories, even crude, to confirm or reject the hypothesis for your specific business model.
- Step 3 — Replace estimates with primary data only where it changes a decision: the top contributors, usually 15 to 30 suppliers or one product family.
- Step 4 — Assign the lever to the function that actually controls it — procurement, R&D, operations or marketing — and fund it as an operational programme, not a reporting exercise.
How BE-CAUSE helps you map and act on your carbon architecture
BE-CAUSE is an ESG compliance platform built for the European and North American companies that source from Asia, and for the Asian suppliers that serve them. Our Scope 3 Screening establishes your carbon architecture across the fifteen GHG Protocol categories and identifies the 20% of suppliers driving 80% of the footprint. Net Zero Pulse then measures the ESG maturity of those suppliers before you send them a single questionnaire, and the Strategic Supplier Development Program takes them from unprepared to audit-ready, with optional physical assessment on site in China. If you want to know where your carbon really sits — and what to do about it this year — start with a value chain readiness check.
常见问题
参考资料
- GHG Protocol — Corporate Value Chain (Scope 3) Accounting and Reporting Standard
- CDP — Global Supply Chain Report
- EFRAG — ESRS E1 Climate Change (CSRD reporting standard)
- European Commission — Carbon Border Adjustment Mechanism (CBAM)
- Science Based Targets initiative — Corporate Net-Zero Standard
- BE-CAUSE — Scope 3 Screening and Net Zero Pulse supplier maturity