
A procurement committee has three proposals on the table and budget for one. Engage the twenty highest-emitting suppliers. Fund a recycled-materials programme. Or rebuild the emissions data system so that next year's numbers can be trusted. The climate team says the data is not good enough to choose. The CFO says the data will never be good enough, and the milestone is still 2030.
That scene now repeats in almost every industrial, consumer and retail group we work with. The first carbon inventory is done. Scope 3 dominates the footprint — often 80 to 95% of it. And the supplier data behind that number is incomplete, heterogeneous, partly estimated and rarely verified. Waiting for a perfect baseline delays every decision. Deciding on bad data risks displacing emissions or mobilising procurement on the wrong lever.
This article is a decision method, not a carbon accounting lesson. The question is not how to make the inventory perfect. It is which decision you can take now, and which piece of data you genuinely need before the next one.
Stop treating the inventory as the deliverable
A Scope 3 inventory is a screening instrument. Its purpose is to tell you where the emissions plausibly sit, at what order of magnitude, so that management attention goes to the right categories. It was never designed to be a management control system accurate to the tonne.
The confusion is expensive. Teams spend two years improving a number that will not change the ranking of their top three categories, while the factories that drive that ranking receive no engineering support at all. Precision has a cost, and the cost is only justified when better precision would change a decision.
“The right question is not 'how accurate is our Scope 3?' but 'which decision would change if this number were twice as accurate?' If the answer is none, the data work can wait.”
Three variables that replace the perfect footprint
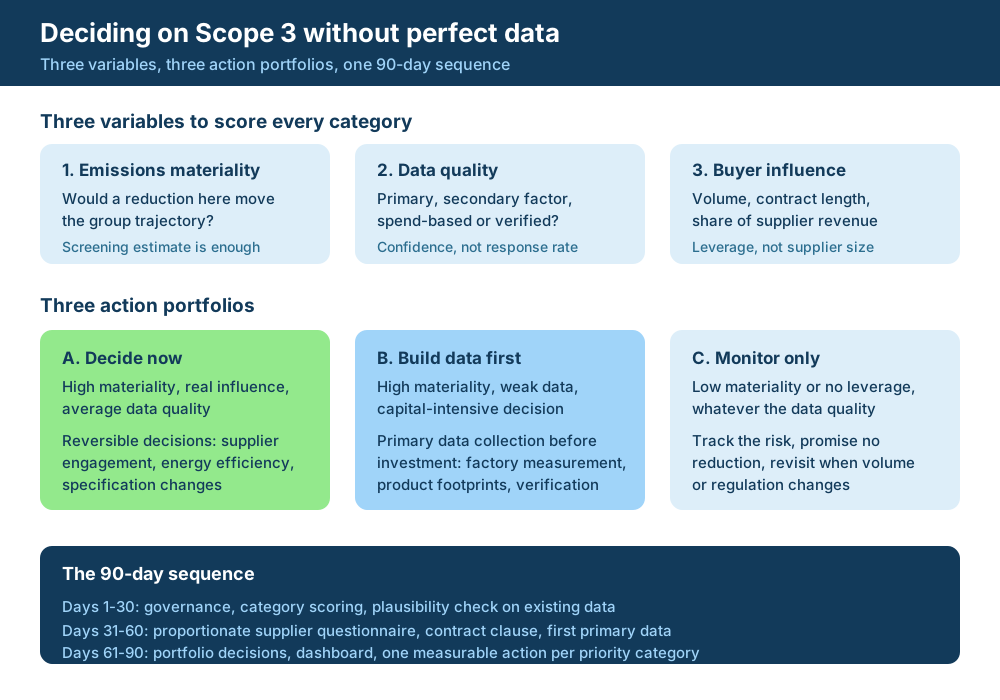
Score every purchasing category — not every supplier — against three variables. Each can be scored high, medium or low in a workshop, using data you already have.
Emissions materiality. Would a credible reduction in this category move the group trajectory? A screening estimate is enough here; you are separating percentage points from decimals.
Data quality. What is actually behind the number: measured primary supplier data, a secondary emission factor, a spend-based estimate, or a verified product footprint? These four are not interchangeable, and a single average conceals which one you used.
Buyer influence. Not the supplier's size, but your leverage: volume, contract length, share of that supplier's revenue, technical involvement in specification, and whether the relationship is expected to survive the next sourcing round.
Crossing these three variables produces three portfolios, and it is the portfolios — not the tonnage — that a committee can act on.
Portfolio A — decisions you can take now, on average data
High materiality, real influence, mediocre data. This is the largest and most neglected portfolio. The decisions here are reversible, low-regret and do not depend on decimal accuracy: joint energy efficiency work at a strategic factory, switching a specification to a lower-carbon material grade, consolidating volumes with suppliers that already measure, adding a decarbonisation clause at the next contract renewal.
None of these require a verified product footprint to start. All of them generate data as a by-product, because a factory that runs an efficiency project has to meter something.
- Choose actions that remain sensible under both the high and low estimate of the category footprint.
- Prefer levers that are physical (energy, process, material, transport mode) over levers that are declarative (a target letter, a pledge, a certificate).
- Fix the review date before you start: a reversible decision needs a moment where it can be reversed.
Portfolio B — data work that must precede the investment
High materiality, weak data, and a decision that involves capital or a long contractual commitment: a change of raw material, a new supplier country, a redesign, a multi-year offtake. Here, deciding on a spend-based estimate is genuinely dangerous, because spend-based factors respond to price, not to physics — a cheaper supplier looks cleaner.
The data work should be narrow and specific: primary measurement at the handful of sites that dominate the category, product footprints on the two or three references that carry the volume, and independent verification where the number will be used externally. This is a targeted campaign with an end date, not a permanent programme to raise the whole supply base.
Portfolio C — risks to monitor, not to promise
Low materiality, or no leverage whatsoever. The honest answer is to track the category, disclose the uncertainty, and commit to nothing. Promising reductions where you have neither influence nor measurement is how a climate plan loses internal credibility — and how, three years later, nobody trusts the trajectory.
Monitoring is a real decision. It has an owner, a trigger and a revisit date: a volume threshold, a regulatory change, a supplier consolidation.
Know which data you are actually holding
Four data types are routinely presented as one. Distinguishing them is the cheapest quality improvement available.
| Data type | What it is | What it can support | What it cannot support |
|---|---|---|---|
| Primary supplier data | Measured activity or energy data from the supplier's own site | Factory-level action plans, verified reductions | Comparability across suppliers without a common boundary |
| Secondary emission factor | An industry- or region-average factor applied to a physical quantity | Category ranking, hotspot detection | Supplier-versus-supplier comparison, product claims |
| Spend-based estimate | Money spent multiplied by a monetary factor | First screening, coverage of the long tail | Any decision where price and carbon move differently |
| Verified product footprint | A product-level calculation with a declared boundary and third-party verification | Customer claims, tenders, regulatory files | Extrapolation to other products or other sites |
Sector examples make the difference concrete. In agricultural materials, spend-based data hides the farming practice that drives most of the footprint. In textiles, it hides the energy source of dyeing and finishing. In steel and aluminium, it hides the process route and the electricity contract. In packaging, it hides recycled content. In transport, it hides mode and load factor.
Where the market tools fit — and where they stop
Most groups already own several pieces of the Scope 3 stack. EcoVadis scores supplier management systems, CDP collects disclosure and supply chain questionnaires, carbon accounting platforms such as Watershed, Persefoni, Sweep, Normative or Sphera consolidate the inventory, and verification bodies such as SGS, TÜV SÜD or Bureau Veritas certify what can be evidenced. Each of these is good at what it was built for. None of them was built to change what happens inside a supplier's factory.
That is the gap this method addresses, and it is where our two offers sit. Net Zero Pulse is a rapid maturity screen: it tells you, per supplier and per category, whether the data behind a number is primary, secondary or spend-based, and whether the supplier has the capability to improve at all. The Strategic Supplier Development Program (SSDP) takes a Portfolio A or B category and turns it into a costed factory plan — local-language diagnosis, engineering options with payback, buyer-supplier incentives and evidence a verifier can accept.
| Layer | Typical tools | What it answers | What it still leaves open |
|---|---|---|---|
| Supplier ratings | EcoVadis, Sedex, Ecoinvent-based scorecards | Does the supplier have management systems and policies? | Whether any tonne of CO₂e actually falls |
| Disclosure and questionnaires | CDP, CDP Supply Chain, SBTi commitments | What suppliers declare, and to whom | Whether the declared data is measured or defaulted |
| Carbon accounting software | Watershed, Persefoni, Sweep, Normative, Sphera | A consolidated, auditable inventory | Which categories to act on, and how |
| Maturity screening | BE-CAUSE Net Zero Pulse | Data type, supplier capability and buyer leverage per category | Execution at factory level |
| Factory execution | BE-CAUSE SSDP | Costed, financed and verified reduction plans on site | Group-level consolidation, which the software layer handles |
| Independent verification | SGS, TÜV SÜD, Bureau Veritas | Whether a claim can be evidenced externally | Nothing to verify without primary data and a real project |
The economics matter as much as the coverage. One supplier questionnaire cycle — chasing responses, cleaning factors, re-explaining the boundary, re-checking the same plants next year — already costs a buying team more internal hours than it ever produces tonnes. Net Zero Pulse and the Strategic Supplier Development Program are priced below the administrative time and energy the company already spends on those same suppliers, and they accelerate decarbonisation across many industries at once: the screening logic, the factory diagnosis and the evidence format hold whether the plant makes textiles, food, chemicals, electronics, packaging or auto parts. That is the moat — cheaper than the status quo, faster than a questionnaire cycle, and transferable from one sector to the next.
The practical rule: keep the platform you already have for consolidation and disclosure, and stop asking it to produce reductions. Screening and factory execution are a different discipline, done in the supplier's language, on the supplier's site.
A 90-day plan a procurement team can actually run
Days 1 to 30 — governance and framing. Name a decision owner in procurement, not only in sustainability. Score the categories on the three variables. Run a plausibility check on the existing inventory: compare category footprints with physical volumes and ask why any category with large volume shows a small footprint.
Days 31 to 60 — proportionate collection. Send a short questionnaire that matches supplier capability; a fifteen-question form to a 40-person factory produces fiction, not data. Insert a data and decarbonisation clause in the contracts up for renewal. Start primary collection at the sites that dominate Portfolio B.
Days 61 to 90 — decide and publish internally. Allocate every priority category to Portfolio A, B or C. Build one dashboard showing, per category, the estimated footprint, the data type behind it and the decision taken. Launch at least one measurable action per Portfolio A category.
In Asian supply chains this sequence needs one addition: the collection step has to run in the supplier's language, with someone who can read a factory's utility bills, not only its questionnaire answers. That is the difference between a response rate and a data set.
What fails most often
- Response rate confused with data quality. Ninety per cent of suppliers answering a questionnaire with default values is not 90% coverage; it is 90% of a guess.
- Double counting between categories — typically purchased goods and upstream transport, or purchased goods and capital goods.
- A generic emission factor presented externally as a product footprint. This is the single most common source of greenwashing exposure in tenders.
- Targets imposed on small suppliers with no financing, no engineering support and no commercial upside. They will sign and not deliver.
- A baseline recalculated silently after an acquisition or a scope change, which quietly erases the trend the plan was built on.
The question to put on the next committee agenda
One sentence is usually enough to unblock a stalled Scope 3 programme: which reversible decision can we take now, and which single piece of data do we genuinely need before the next one?
It forces the discussion out of accounting and into strategy. It gives the climate team a reason to prioritise data work instead of chasing all of it. And it gives procurement something it can put in a contract.
If you want to see where your own categories fall across the three variables, our 15-minute Value Chain Readiness benchmark produces a first scoring, and the Strategic Supplier Development Program turns a Portfolio A or B category into a costed factory plan with verified evidence.
Frequently asked questions
References
- GHG Protocol — Corporate Value Chain (Scope 3) Accounting and Reporting Standard
- GHG Protocol — Technical Guidance for Calculating Scope 3 Emissions
- WBCSD — Pathfinder Framework: accounting and exchange of product life cycle emissions
- ISO 14067 — Greenhouse gases: carbon footprint of products
- EFRAG — ESRS E1 Climate change, value chain data and estimation
- Science Based Targets initiative — Corporate Net-Zero Standard
- CDP — Supply chain reporting and data quality analysis