
By Emmanuel Delplanque, Co-Founder & CEO of BE-CAUSE. If you want to understand a company's true sustainability strategy, do not read the CEO's letter. Do not look at the photographs of solar panels on the headquarters' roof. Turn instead to the data tables at the back of the ESG report and look at three specific lines: Scope 3 Category 1 (Purchased Goods and Services), Category 11 (Use of Sold Products) and Category 12 (End-of-Life Treatment of Sold Products).
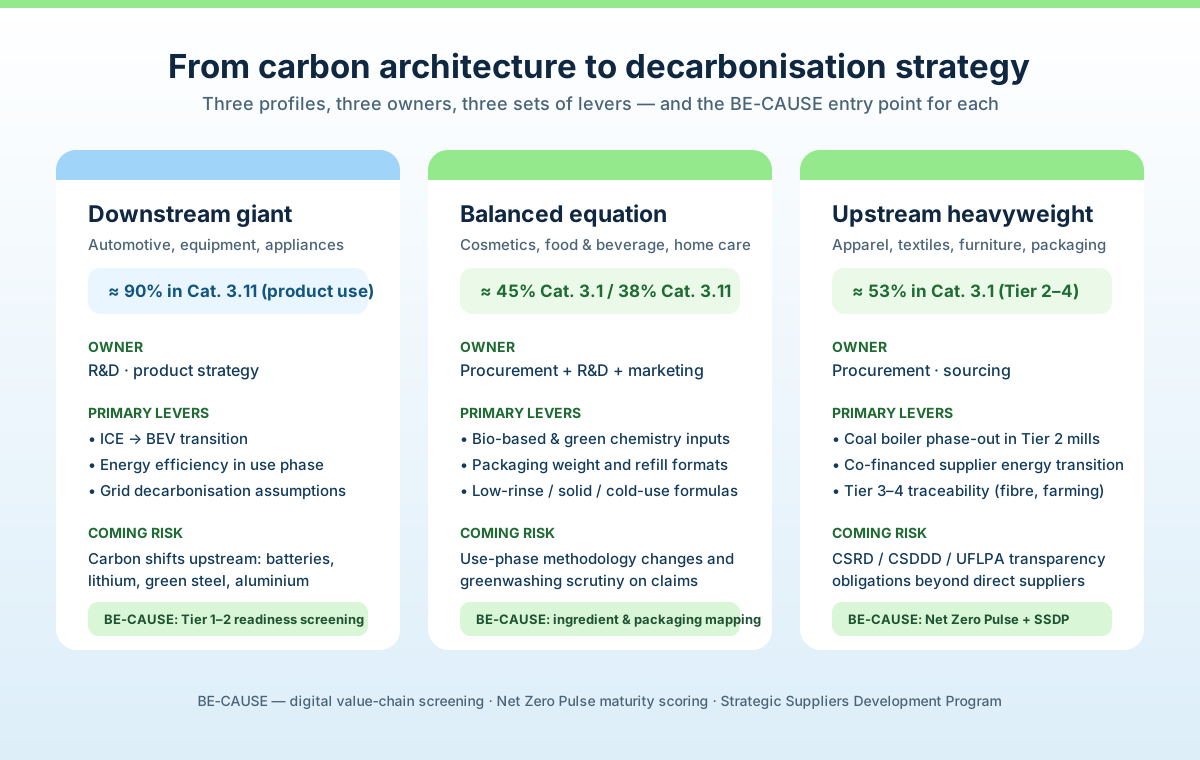
The distribution of carbon across these three categories is the DNA of an industry's environmental impact. It dictates where the power lies, where the money must flow, and whether the primary decarbonisation lever sits with the Chief Procurement Officer, the Chief Marketing Officer or the R&D Director. To illustrate this, we extracted the 2023 carbon data of three global leaders operating in radically different sectors: L'Oréal (cosmetics), Stellantis (automotive) and Levi Strauss & Co. (apparel). The comparison reveals a fundamental truth: there is no single playbook for Scope 3. The strategy must follow the carbon.
Why Scope 3 is the only line that really matters
For most product-based companies, Scope 1 and Scope 2 together represent between 1% and 15% of the total footprint. Everything else — the other 85% to 99% — sits in Scope 3, split across fifteen GHG Protocol categories. Yet three of those categories usually carry the overwhelming majority of the tonnage. Category 1 covers everything a company buys: raw materials, components, ingredients, packaging, and the energy burned by suppliers to transform them. Category 11 covers what happens when the customer uses the product: fuel burned, electricity drawn, water heated. Category 12 covers what happens when the product is discarded: landfill, incineration, recycling.
Read those three lines and you know, within a rounding error, which internal function actually controls the company's climate trajectory. Everything else — offsets, green electricity contracts, headquarters retrofits — is a rounding error on the rounding error.
The data: three distinct carbon architectures
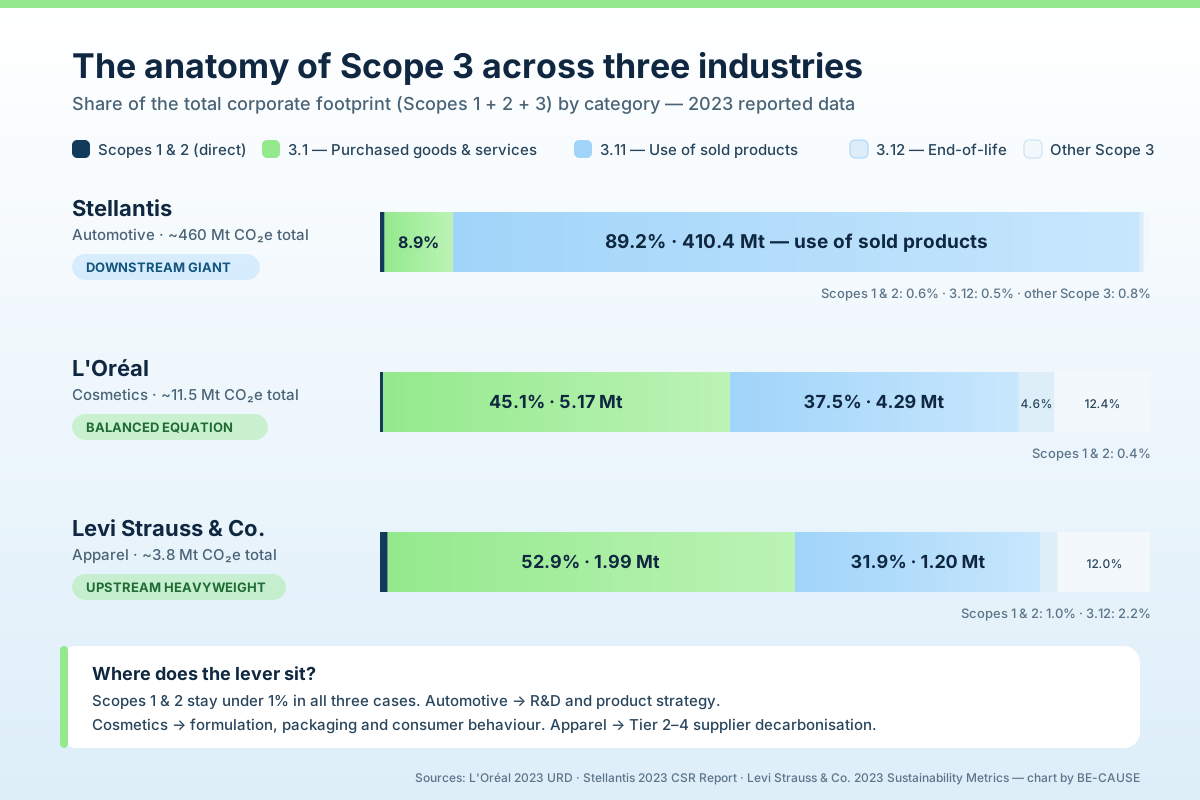
Before diving into strategy, let us look at the raw architecture of their emissions, based on 2023 reported data.
| Company / sector | Total Scope 3 | Cat. 3.1 (purchased goods) | Cat. 3.11 (product use) | Cat. 3.12 (end-of-life) |
|---|---|---|---|---|
| Stellantis (automotive) | ~457.6 Mt CO₂e | 9.0% (41.4 Mt) | 89.7% (410.4 Mt) | 0.5% (2.1 Mt) |
| L'Oréal (cosmetics) | ~11.4 Mt CO₂e | 45.3% (5.17 Mt) | 37.7% (4.29 Mt) | 4.6% (0.52 Mt) |
| Levi Strauss & Co. (apparel) | ~3.7 Mt CO₂e | 53.4% (1.99 Mt) | 32.2% (1.20 Mt) | 2.2% (0.08 Mt) |
Sources: L'Oréal 2023 Universal Registration Document; Stellantis 2023 CSR Report; Levi Strauss & Co. sustainability metrics. Important caveat: L'Oréal's 2023 Category 11 figure includes the indirect energy consumers use to heat water when rinsing products. Since its 2024 Universal Registration Document, the group has excluded those indirect emissions from the reported line and discloses them only in a footnote — a perimeter change we analyse in detail further down.
Note the scale difference as well as the shape difference. Stellantis emits roughly 124 times more Scope 3 carbon than Levi's, but the interesting number is not the total — it is the distribution. These percentages tell three completely different stories about where transformation must happen, and who inside the company must lead it.
Profile 1 — Stellantis: the downstream giant
The architecture: 90% of emissions occur after the product is sold (Category 11). Only 9% come from the supply chain (Category 1). In the automotive sector, the supply chain is massive and complex — tens of thousands of parts, thousands of Tier 1 suppliers, a Tier 2 and Tier 3 base that few carmakers can fully name — but its carbon impact is entirely dwarfed by the fact that the product burns fossil fuels for fifteen years.
The strategy: for Stellantis, the primary decarbonisation lever is not procurement; it is R&D and product strategy. The transition from internal combustion engines (ICE) to battery electric vehicles (BEV) is the only way to move the needle on that 89.7%. No amount of supplier engagement, renewable electricity purchasing or logistics optimisation can compensate for a product mix that keeps burning petrol on the road.
But here is the twist that most automotive sustainability teams underestimate. As tailpipe emissions drop toward zero with electrification, the carbon weight shifts drastically upstream into Category 3.1: lithium and nickel mining, cell manufacturing, aluminium, and green steel. A battery electric vehicle typically carries a 40% to 60% higher manufacturing footprint than its ICE equivalent, concentrated in the battery. Mechanically, as the 90% shrinks, the 9% becomes the dominant share. Procurement teams in the automotive industry are currently in a grace period — and the transparency cliff is coming for them fast.
“Electrification does not eliminate automotive carbon. It relocates it — from the road to the mine, the smelter and the cell plant.”
— BE-CAUSE

Profile 2 — L'Oréal: the balanced equation
The architecture: a split burden. Around 45% sits in the supply chain (ingredients, packaging, contract manufacturing) and 38% in product use, largely driven by consumers heating water. Cosmetics presents a unique dual challenge. The upstream impact is highly fragmented: thousands of agricultural ingredients, petrochemical derivatives, glass, aluminium and plastic packaging formats, spread across hundreds of formulation and filling sites. The downstream impact is behavioural: a shampoo's carbon footprint spikes because consumers take long, hot showers.
The strategy: this requires a perfectly synchronised cross-functional approach, because no single function owns more than half the problem.
- Upstream (Procurement & R&D): green sciences — replacing petrochemical derivatives with bio-based and biotech ingredients, reformulating for lower-impact inputs, and radically reducing packaging weight, switching to refills, mono-materials and recycled content (Category 1).
- Downstream (Innovation & Marketing): altering consumer behaviour and product physics — leave-in conditioners, solid shampoos, cold-water formulas and fast-rinse actives directly attack the 37% sitting in Category 11. In cosmetics, marketing is not a communication function; it is a primary decarbonisation actor.
- Cross-cutting (Data & Compliance): with a supplier base counted in thousands and a use phase estimated from consumer behaviour models, methodology governance becomes a strategic risk. A change in the water-heating assumption can move millions of tonnes on a single reporting line.
This last point deserves emphasis. When a third of your footprint depends on an assumption about how long a consumer stands in the shower, your carbon number is only as credible as your methodology documentation. Under CSRD assurance, that documentation is now audited.
The elephant leaves the room: how L'Oréal redrew its Category 11 perimeter
Here is where the story becomes genuinely instructive — and where the 2023 figures we used above stop being comparable with what L'Oréal publishes today. Since the 2024 Universal Registration Document, and again in the 2025 edition, L'Oréal no longer reports Category 11 on the same perimeter. The line labelled "Use of sold products" now contains only the direct emissions associated with using the product: 113,608 tCO₂e in 2024, against 96,227 tCO₂e restated for 2023. The indirect use-phase emissions — overwhelmingly the energy consumers burn to heat the water in which they rinse shampoos, conditioners and cleansers — are disclosed in a footnote and excluded from the reported total: 4,371,584 tCO₂e in 2024 and 4,178,961 tCO₂e in 2023.
Read those numbers twice. The excluded footnote is roughly thirty-eight times larger than the reported category. The elephant did not leave the building; it left the table.
Why the change is technically defensible
The stated justification is precise and, on the letter of the standard, correct: the GHG Protocol classifies indirect use-phase emissions as optional reporting. For products that do not consume energy themselves — a shampoo does not have a plug — the emissions arise from a consumer appliance (a water heater, a shower, a hairdryer) that the company neither manufactures nor operates. On top of that, CSRD and ESRS E1-6 push companies toward auditable figures. An estimate built on assumed shower duration, assumed water temperature, assumed national grid and gas mixes across a hundred countries is extraordinarily hard to place under limited assurance. Narrowing the perimeter makes the number defensible in front of an auditor.
Why it still changes the strategy
The accounting is defensible; the strategic side effect is the problem. Move 4.4 Mt out of the reported footprint and the carbon architecture of the company inverts on paper. Category 1 — purchased goods and services, 5.36 Mt in 2024 — becomes almost the entire story, while the use phase collapses to roughly 1.5% of reported Scope 3. The "balanced equation" profile we described above becomes, in the published accounts, an upstream profile. Three consequences follow.
- Budget follows the reported number. Sustainability budgets, SBTi trajectories and executive incentive plans are indexed on reported tonnes. What is no longer counted no longer competes for capital — and the R&D programmes that reduce rinse time, enable cold-water performance or shift formats to solids and leave-ins lose their strongest internal argument.
- Reduction gets easier without the product changing. A category that shrank from 4.3 Mt to 0.1 Mt by definition delivers percentage reductions that no reformulation ever could. Progress against a 2030 target can improve while the physical impact in consumers' bathrooms stays exactly where it was.
- The incentive to redesign weakens. Cold-water actives, low-rinse formulas, solid bars and dry shampoo are expensive, slow, and commercially risky innovations. They are also the only levers on the 4.4 Mt. When those tonnes sit in a footnote, the business case has to be made on brand and consumer preference alone.
“Changing the perimeter is not greenwashing. But it is the quietest way to make an elephant disappear from a balance sheet — and the tonnes are still in the bathroom.”
— BE-CAUSE
To be fair to L'Oréal, the group publishes the excluded figure rather than hiding it, which is more transparency than most of its peers offer. And the underlying insight is real: the company genuinely does not control how hot a consumer's shower is. But a footnote is not a target. The cosmetics sector as a whole is drifting toward the same narrower perimeter, and the consequence is a market-wide loss of comparability: two brands with identical products can now publish use-phase numbers that differ by two orders of magnitude, purely as a function of methodological choice.
What this means for your own reporting
Three practical rules come out of this case. First, never compare Category 11 across companies or across years without reading the methodology note underneath the table — a perimeter change can dwarf a decade of genuine reduction. Second, if you narrow a perimeter, keep the excluded emissions in your internal steering model, with an owner and a reduction plan, even when they leave the audited statement; otherwise the innovation pipeline quietly reprioritises itself. Third, expect the question to come back: CSDDD, consumer-protection authorities scrutinising green claims, and the coming revisions of the GHG Protocol Scope 3 standard are all pushing toward more, not less, use-phase transparency. A perimeter that is optional in 2026 may not be optional in 2029.
This is precisely the kind of discontinuity a digital screening exercise is designed to surface. At BE-CAUSE, when we rebuild a client's carbon architecture, we systematically reconstruct the like-for-like series behind reported figures — perimeter changes, emission-factor updates, restatements — because a decarbonisation strategy built on a discontinuous baseline is a strategy built on sand.
Profile 3 — Levi's: the upstream heavyweight
The architecture: the inverse of automotive. More than 53% of emissions happen before the product reaches the shelf (Category 1), and 32% during use (washing and drying). In apparel, the product does not consume energy by itself, but creating it requires immense amounts of energy and water: fibre production, spinning, weaving and knitting, and above all wet processing — dyeing, washing and finishing.
The strategy: for Levi's and the fashion industry at large, procurement is the frontline of climate action. As we detailed in our Denim Supply Chain white paper, the bulk of that 53% sits in Tier 2 — fabric production — where coal-fired boilers remain widespread across South and East Asia. A brand that decarbonises its own stores and offices while its Tier 2 mills run on coal has moved perhaps 2% of its footprint.
To decarbonise, apparel brands cannot rely on eco-design alone. They must deploy aggressive supplier engagement programmes with real technical content: boiler conversion, heat recovery, process water reduction, rooftop solar and power purchase agreements. They must co-finance that transition, because a Tier 2 mill working on thin margins will not fund a decarbonisation capex to satisfy a buyer that places seasonal orders. And they must deploy deep digital screening to map the risks hiding in Tier 3 and Tier 4 — fibre and cotton farming — where CSRD, CSDDD and UFLPA now demand total transparency and, increasingly, documentary proof of origin.
Why carbon alone is the wrong lens for apparel
There is a second lesson in the Levi's profile, and it is the one most brands miss: in apparel, greenhouse gases are a topic, not the topic. The same Tier 2 wet-processing step that burns coal is also the step that consumes and contaminates water, and the same Tier 3–4 cotton and fibre nodes that are hardest to trace for carbon are the nodes where forced labour, wage and health-and-safety risks concentrate. Optimising a single indicator across that footprint produces perverse outcomes — a mill that switches to a more water-intensive dyeing process to cut energy, or a brand that reallocates volumes to a lower-carbon country with weaker labour enforcement.
Water makes the point concretely. Cotton cultivation and wet processing dominate the water footprint of a pair of jeans, and Levi Strauss built its Water<Less® programme and its Water Recycle/Reuse standard precisely because water scarcity — not carbon — is the constraint that can shut a mill down in Xinjiang-adjacent, South Asian or North China basins. A carbon-only screening would rank those mills as acceptable right up to the day the local water bureau caps their withdrawals.
Social conditions make it legally binding. CSDDD, the German LkSG, the EU Forced Labour Regulation and UFLPA do not ask for tonnes of CO₂e — they ask whether you know who works in your Tier 2 and Tier 3, under what contracts, at what wage, with what grievance mechanism. A brand can be perfectly on track for its SBTi trajectory and still have its containers detained at customs. And the reverse is also true: the supplier data collection needed for social due diligence is 80% the same data collection needed for carbon.
This is why our Net Zero Pulse maturity assessment and our Strategic Supplier Development Program score suppliers on a multi-dimensional basis — energy and GHG, water and effluents, chemical management, and labour and social governance — rather than on carbon alone. You visit a mill once, you collect once, and you serve CSRD, CSDDD, your customers' audits and your climate target from the same evidence base. Screening for carbon only means paying for the same visit three times, and discovering the water and social exposures when a client audit, an NGO report or a customs officer finds them for you.
What about Category 12 — and why it is about to matter much more
In all three profiles, Category 12 looks negligible: 0.5%, 4.6% and 2.2%. It is tempting to ignore it. That would be a mistake, for three reasons.
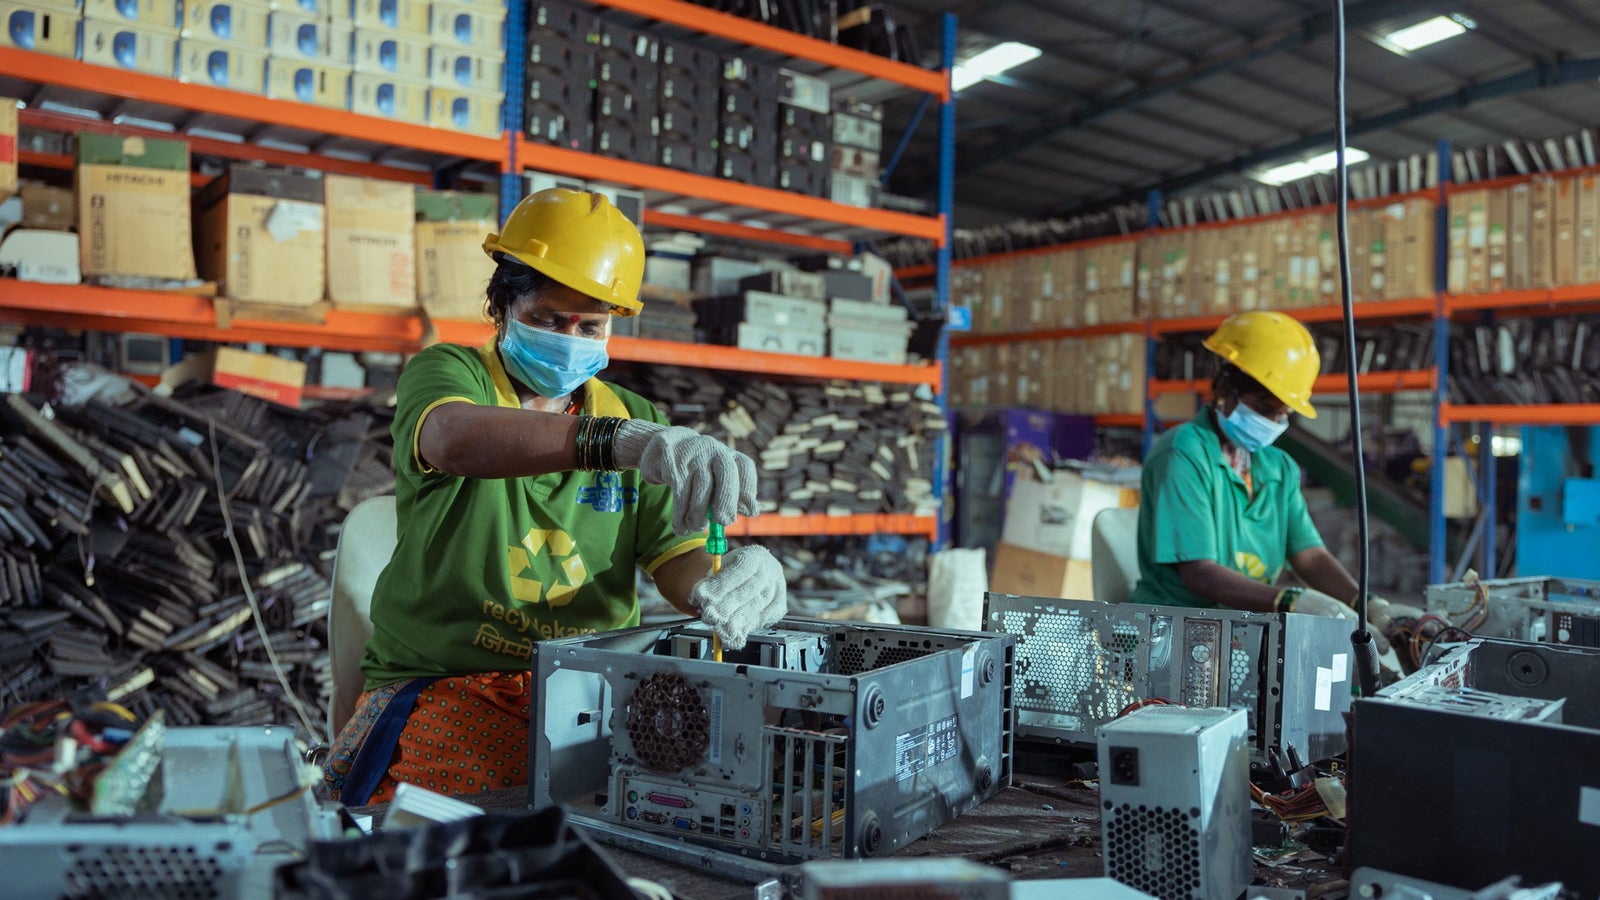
- Accounting convention, not reality. End-of-life emissions are typically calculated on waste treatment only — the incineration or landfill of the product — and exclude the embodied carbon destroyed when a usable product is discarded. The economic and material loss is invisible in the tonnage.
- Regulation is repricing it. Extended Producer Responsibility schemes, the EU Ecodesign for Sustainable Products Regulation, the Digital Product Passport and forthcoming durability and repairability requirements attach cost and legal obligation to a line that carries very little carbon.
- It is the lever that reduces Category 1. Every product kept in service, repaired, resold or remanufactured is a product that does not need to be produced. Circularity is not primarily a Category 12 strategy — it is a Category 1 strategy that happens to be recorded under Category 12.
How to read your own carbon architecture in four steps
The three profiles above are archetypes. Most companies recognise themselves in one of them within minutes. The practical work is to confirm it with your own data and translate it into budget allocation.
- Rebuild the breakdown, not the total. Ask for Scope 3 by category, in tonnes and in percentage, over three years. If your provider can only give you a single consolidated number, you cannot build a strategy from it.
- Test the quality of each line. Which categories are spend-based (average emission factors applied to euros spent) and which are activity-based or supplier-specific? Spend-based lines cannot reward a supplier that decarbonises — they only fall when you buy less or negotiate prices down.
- Identify the owner of each dominant category. Assign the 80% to a named executive with a budget, not to a sustainability team without one.
- Set the transparency roadmap by tier. If your carbon sits in Category 1, decide now how far down the tiers you need visibility, and by when — CSDDD and UFLPA already presume you know.
The takeaway: stop copying, start mapping
The comparison between Stellantis, L'Oréal and Levi's proves why generic sustainability playbooks fail. You cannot apply an automotive decarbonisation strategy to a fashion brand. If your footprint looks like Levi's, investing 80% of your sustainability budget in eco-design while ignoring your Tier 2 suppliers is a mathematical error. If your footprint looks like L'Oréal, ignoring how the consumer interacts with your product in their bathroom means ignoring a third of your impact. If your footprint looks like Stellantis, celebrating supplier engagement while your product mix stays combustion-based is a communication exercise, not a strategy.
How BE-CAUSE helps you map your carbon architecture
At BE-CAUSE we always start engagements with a deliberately simple step: show us your Scope 3 breakdown. Before launching complex supplier development programmes or funding R&D innovation, you must know where your carbon actually sits — and how solid the data behind each line is.
- Digital screening of the whole value chain. We map your suppliers tier by tier, including the Tier 2 and Tier 3 layers most brands cannot name, and identify where emissions, regulatory exposure and dependency concentrate.
- Net Zero Pulse. Our maturity assessment measures where each supplier really stands on measurement, governance, energy and data readiness — so you can distinguish a supplier that needs training from one that needs capex co-financing.
- Strategic Suppliers Development Program. We accelerate awareness and capability building with your strategic suppliers, and embark them into your transformation quickly and durably, with milestones tied to your CSRD and CSDDD calendar.
- China-compliant data architecture. For suppliers based in China, raw data stays on China-based servers in line with Decrees 834 and 835 and PIPL, while only computed scores and consented outputs reach your European or US headquarters.
Whether your biggest risk lies in Tier 1 or Tier 4, in the product's use phase or in its fabric mill, the method is the same: measure the architecture first, then deploy the exact levers your architecture demands. Because in the end, the maths does not lie. Your Scope 3 is your strategy.
BE-CAUSE helps companies navigate their value chains and measure supplier maturity. Book a demo, or run our free supply-chain diagnosis, to see where your carbon architecture places you.
Frequently asked questions
References
- L'Oréal — 2025 Universal Registration Document (Sustainability Report)
- L'Oréal — 2024 Universal Registration Document, GHG assessment (E1-6): Category 11 perimeter footnote
- Stellantis — 2023 Corporate Social Responsibility Report
- Levi Strauss & Co. — Sustainability reporting and metrics
- GHG Protocol — Corporate Value Chain (Scope 3) Accounting and Reporting Standard
- European Commission — Corporate Sustainability Reporting Directive (CSRD)
- BE-CAUSE — Denim Supply Chain Decoded white paper