
Carbon data requirements are moving from the company to the product. Automotive, construction materials, glass, technical equipment, packaging, textile and a growing share of consumer goods now receive — or send — a product carbon footprint with the quotation. The problem is that most of these PCFs arrive as a single figure: 4.7 kg CO2e per unit, no boundary, no method, no date, no verification.
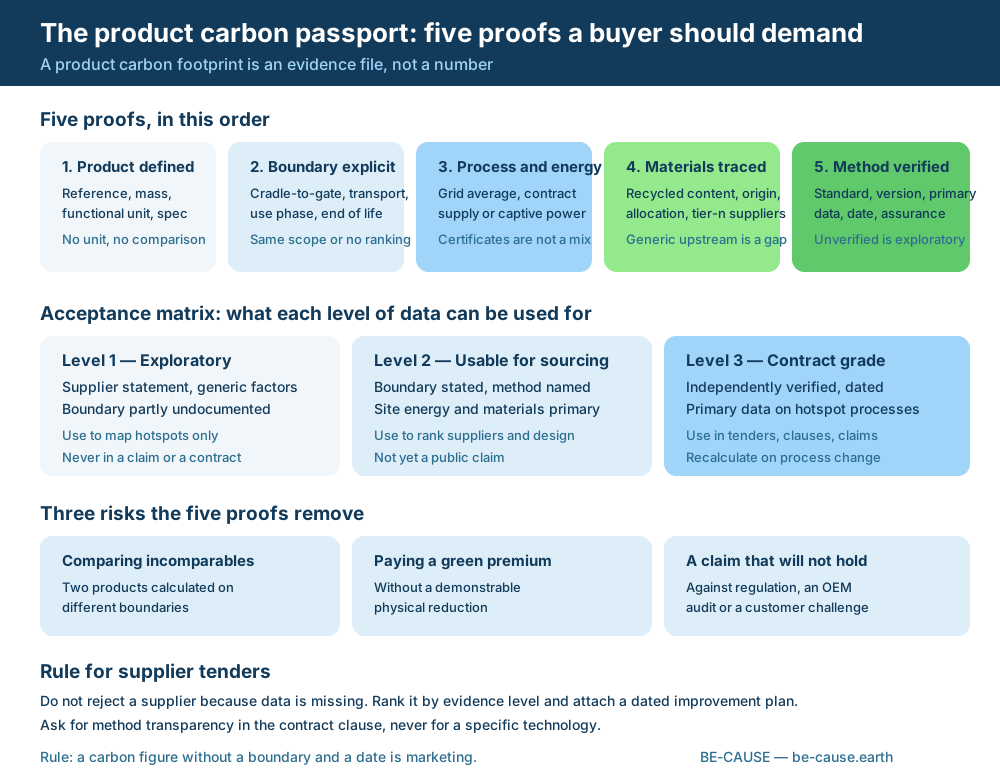
A number like that cannot be compared, cannot be contracted on, and cannot be defended in front of a regulator or an OEM audit. A product carbon footprint is not a number. It is an evidence file. This article sets out the five proofs a buyer should demand, a three-level acceptance matrix, and the ten fields to put in the next tender.
Proof 1 — The product is actually defined
Before any emission factor, the object being measured has to be unambiguous: commercial reference, technical specification, mass, and above all the functional unit. One kilogram of resin, one finished part, one square metre of glazing installed and one year of service are four different questions. Suppliers frequently quote per kilogram while the buyer reasons per part, which makes two quotations look comparable when they differ by a factor of three.
Ask for the reference, the mass, the functional unit and the declared production site. A PCF that does not name the plant is a corporate average dressed as a product figure — useful for a first map, useless for a sourcing decision between two factories of the same group.
Proof 2 — The boundary is explicit
Cradle-to-gate, cradle-to-customer, cradle-to-grave: the boundary changes the result far more than any technology the supplier has installed. Inbound transport included or not, packaging included or not, use phase and end of life counted or excluded, capital goods in or out — each of these choices moves the figure. Comparing two products calculated on different boundaries is the most common and the most expensive mistake in supplier carbon data.
The requirement is simple: the boundary must be written on the same page as the number, in the same language as your specification. If your category is compared cradle-to-gate, every supplier answers cradle-to-gate, and any addition is reported separately.
Proof 3 — The process and the energy are documented
This is where credible PCFs separate from marketing ones. Three energy realities produce three different footprints on the same production line: the grid average of the region, a contractual supply backed by a specific generation asset, and captive on-site generation. A supplier that reports a low figure on the strength of purchased certificates, while the meter shows a coal-heavy provincial grid, has produced an accounting result, not a physical one.
Ask for measured site consumption over a stated period, the split between electricity and thermal energy, the fuel used for process heat, and the evidence behind any renewable claim: contract, generation asset, hourly or annual matching, and the country's attribution rules. Process heat is usually where the real carbon sits, and it is almost always the least documented line in a supplier PCF.
“A certificate is a contractual claim. A meter reading is a fact. A credible PCF shows both and says which one it used.”
Proof 4 — The materials are traced
In most manufactured goods, upstream materials dominate the footprint. The proof to demand is therefore: material origin, recycled content and how it is substantiated, the emission factors applied to each input with their source and vintage, the allocation rule for co-products and for recycled inputs, and the identity of tier-n suppliers for the two or three inputs that drive the result.
Generic upstream data is not disqualifying by itself — nobody has primary data on every input. It becomes disqualifying when it covers the hotspot. If 70% of a part's footprint comes from one alloy or one polymer, that line has to be primary or at least regionally specific; the rest can stay generic without harming the decision.
Proof 5 — The method is verified
Finally: which standard, which version, which product category rules if any, how much of the result rests on primary data, when was it calculated, and who checked it. Independent assurance is not a formality — it is what makes the figure usable in a contract clause or a public claim. And a PCF has a shelf life: a process change, a new supplier for a key input or a change in the site's energy contract invalidates it.
| Proof | What to ask for | Red flag | What it protects |
|---|---|---|---|
| Product definition | Reference, mass, functional unit, plant | Group average, no site named | Comparing like with like |
| Boundary | Cradle-to-gate or beyond, stated in writing | Boundary absent or 'standard' | Ranking suppliers fairly |
| Process and energy | Metered consumption, fuel for heat, contract evidence | Certificate-only renewable claim | Paying for real reduction |
| Materials | Origin, recycled content, factors, allocation | Generic factor on the hotspot input | Design and sourcing decisions |
| Verification | Standard, version, primary-data share, assurance, date | No date, no verifier | Claims and contract clauses |
The acceptance matrix: three levels, three uses
- Level 1 — exploratory. Supplier statement with generic factors and a partly documented boundary. Use it to map hotspots and prioritise engagement. Never in a claim, a contract or a customer-facing comparison.
- Level 2 — usable for sourcing. Boundary stated, method named, site energy and main materials primary. Use it to rank suppliers, choose a design and set a reduction target with the supplier. Not yet a public claim.
- Level 3 — contract grade. Independently verified, dated, primary data on the hotspot processes. Use it in tenders, contract clauses and external claims, and recalculate it whenever the process or the energy supply changes.
The point of the matrix is not to fail suppliers. It is to stop a Level 1 figure from travelling silently into a Level 3 use — which is how a procurement decision becomes a greenwashing exposure two years later.
Do not reject the supplier — rank it
A supplier without a full PCF is not a bad supplier; very often it is a competent factory with no carbon accounting function. Rejecting it removes capacity and teaches nothing. Classify it instead: evidence level today, materiality of what it supplies, and a dated improvement plan with two or three specific gaps to close — usually metering, the heat fuel line and the hotspot material factor.
That classification is also the honest answer to a common internal question: why do we not just ask everyone for verified data? Because verification costs money and time, and most of your supply base does not carry enough of the footprint to justify it. Spend Level 3 effort on the 10% of references that drive the result.
Ten fields for your next tender
- Commercial reference and technical specification of the product quoted.
- Functional unit and mass per unit.
- Production site — name, city, country.
- Boundary applied, and what is explicitly excluded.
- Standard and version used, plus any product category rules.
- Metered site energy for the period, split electricity and thermal, with the fuel used for heat.
- Evidence for any renewable or low-carbon energy claim: contract type, asset, matching basis.
- Bill of materials for inputs above 10% of the footprint, with factor source and vintage.
- Recycled content, its substantiation and the allocation rule applied.
- Calculation date, share of primary data, verifier name and assurance level.
A workable clause reads: the supplier provides a product carbon footprint calculated to ISO 14067 or the GHG Protocol Product Standard, states its boundary and calculation date, provides metered energy data for the producing site, and agrees to recalculate on any material process or energy change. Note what the clause does not do: it does not impose a technology, a fuel or a supplier of energy. Buyers who specify the technology end up paying for it; buyers who specify the evidence get the reduction.
Where the market tools fit — and where they stop
Most groups already run part of this. EcoVadis and Sedex score management systems and policies. CDP collects disclosure and supply-chain questionnaires. Carbon accounting platforms — Watershed, Persefoni, Sweep, Normative, Sphera — consolidate the inventory and apply factors. LCA specialists build the model. Verification bodies such as SGS, TÜV SÜD and Bureau Veritas assure what can be evidenced. Digital product passport platforms will carry the resulting data. Each does its job. None of them tells a buyer whether the factory behind this specific reference can actually produce Level 2 or Level 3 data next quarter.
That is the step our two services cover. Net Zero Pulse screens a supplier portfolio site by site and returns, for each one, the evidence level of its product and energy data and what it would take to move up a level — so a category manager knows which references can support a claim and which cannot. The Strategic Supplier Development Program then works inside the plant in the local language: metering, heat and material mapping, costed improvement projects, buyer–supplier incentives, and verification of what was actually installed and measured.
| Layer | Typical providers | Question answered | What it does not do |
|---|---|---|---|
| Supplier ratings | EcoVadis, Sedex | Does the supplier have systems and policies? | Says nothing about product-level data quality |
| Disclosure and targets | CDP, SBTi | Is the commitment disclosed and benchmarked? | No product boundary, no plant evidence |
| Carbon accounting | Watershed, Persefoni, Sweep, Normative, Sphera | What is the consolidated footprint? | Does not produce the supplier's primary data |
| Verification | SGS, TÜV SÜD, Bureau Veritas | Does the published figure hold up? | Assures after the fact, does not build the file |
| Screening (Net Zero Pulse) | BE-CAUSE | Which sites can evidence what — and how to steer the whole supplier ecosystem, not one factory at a time | Not a full LCA model |
| Plant execution (SSDP) | BE-CAUSE | Are the ESG commitments made by sales actually implemented by management and deployed on the shop floor — beyond paperwork and AI-filled questionnaires | Neither a rating nor a reporting platform |
Cost matters here too. A round of PCF requests — chasing responses, cleaning boundaries, re-explaining the functional unit, then repeating it next year on the same references — usually consumes more internal time than the data it produces is worth. Net Zero Pulse and the Strategic Supplier Development Program are priced below the administrative time and energy buyers already spend on the same suppliers, they move faster than a questionnaire cycle, and they transfer across industries: the evidence grid, the acceptance levels and the plant diagnosis are the same whether the factory makes textile, food, chemicals, electronics, packaging or automotive parts. That is the moat — cheaper than the status quo, faster than a questionnaire round, and portable from one sector to the next.
The question to put to your category managers
Not "do we have PCFs from our suppliers?" but: for the twenty references that carry most of our product footprint, what evidence level do we hold today, and which of them could survive a customer or regulator asking for the boundary, the metered energy and the verifier? If the answer is unknown for references you already market as low-carbon, that gap is this quarter's priority — well before the next data platform.
Frequently asked questions
References
- ISO 14067 — Carbon footprint of products
- GHG Protocol — Product Life Cycle Accounting and Reporting Standard
- ISO 14040 / 14044 — Life cycle assessment principles
- WBCSD PACT — Pathfinder Framework for product carbon data exchange
- European Commission — Ecodesign for Sustainable Products Regulation and Digital Product Passport
- European Commission — Green Claims and empowering consumers
- EU — Carbon Border Adjustment Mechanism
- EU Battery Regulation — product carbon footprint requirements
- EPD International — Product Category Rules
- GHG Protocol — Scope 2 guidance on market and location-based accounting