
The short answer: China will not become a zero-carbon workshop by scale alone. But the shift of its power system towards non-fossil sources can create pockets of manufacturing that are genuinely competitive on carbon. The winners will not be a whole industry or a whole province. They will be sites that combine four conditions: demonstrable low-carbon electricity, a suitable process, less emissive raw materials and credible accounting. South-West aluminium is the most tangible case; recycled steel, North-West hydrogen and transition equipment are the next bets.
China is simultaneously the world's largest CO₂ emitter, the largest producer of transition equipment and the place where the biggest renewable system is being built. That coexistence produces a frequent misreading: either the country is reduced to its coal, or it is already treated as a clean industrial power. Both images are incomplete.
The decisive question is not whether Chinese manufacturing as a whole is greener than Western manufacturing. It is more precise: which products, made in which territories and with which processes, can cut their carbon intensity fast enough to change global industrial competition? The question also has a geopolitical dimension. Chinese exports to Africa and South-East Asia can accelerate the move away from fossil fuels through solar, batteries, electric vehicles and grids. But the expansion of regional value chains can also transfer the most carbon-intensive stages of metallurgy, refining or chemicals to those regions.
The electricity shift is real; net zero is not yet
In 2025, low-carbon sources supplied around 42% of Chinese electricity according to Ember, while fossil fuels still supplied 58%. In the same year, coal generation fell by 71 TWh — its first decline since 2015. The movement is significant, but one year of falling coal is not, on its own, a durable exit from coal.
The 15th Five-Year Plan nevertheless moves the horizon. The authorities target a 50% non-fossil share of electricity by 2030, roughly 3,500 GW of renewable capacity and close to 6,000 TWh of annual renewable generation. They explicitly connect that programme to zero-carbon parks and factories, the modernisation of traditional industries and better carbon accounting.
This is not yet a net-zero grid trajectory. It is a change of industrial regime: low-carbon electricity is progressively becoming a location resource. In the International Energy Agency's announced pledges scenario, the Chinese power sector would reach net zero before 2055, with close to 80% of generation from renewables in 2060. That is a scenario, not a forecast nor an updated government commitment; its value is to make the scale of the coming shift visible.
| Milestone | What is observed or decided | What it does not yet prove |
|---|---|---|
| 2025 | Low-carbon sources reach 42% of Chinese electricity; solar and wind account for 22%. | That an average Chinese product is now low-carbon. |
| 2030 | The public target is 50% non-fossil electricity, with around 6,000 TWh of renewable generation. | That every factory will have access to that electricity, at every hour. |
| 2055–2060 | The IEA scenario envisages a net-zero power sector before 2055 and renewables-dominated generation in 2060. | That a linear path is guaranteed, free of grid, storage, water or back-up coal constraints. |
The distinction between capacity, generation, delivery to the site and verified carbon attribute is critical. A province can install enormous solar and wind volumes while still feeding a smelter from a captive coal plant. Likewise, a green electricity contract does not always demonstrate the hourly intensity of an exported product. For international buyers, the question is therefore not “is China greening?” but: which electricity actually powered this tonne of aluminium, this battery, this kilogram of silicon?
Four filters to spot the real industrial winners
Grid decarbonisation does not reduce all industrial emissions in the same way. It first favours products where electricity is a dominant share of the footprint, and much less those where CO₂ comes primarily from a chemical reaction or a fuel burned directly in the process.
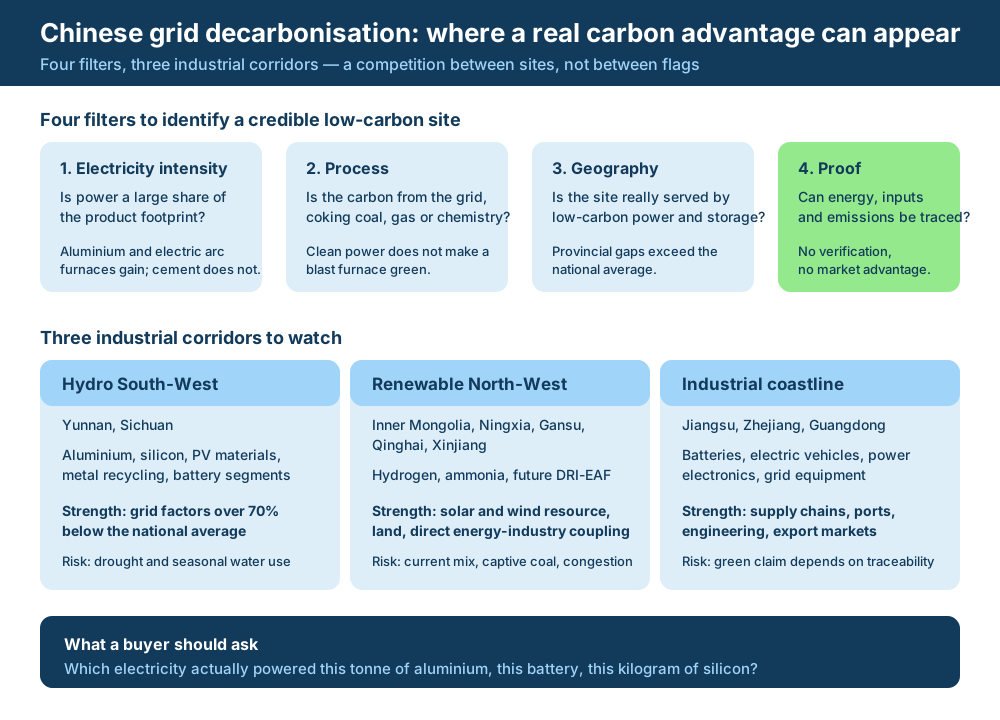
| Filter | Question to ask | Industrial consequence |
|---|---|---|
| Electricity intensity | Is electricity a large share of the product footprint? | Aluminium, electric furnaces, electrolysis and some battery materials benefit far more than conventional cement. |
| Process | Is the carbon tied to the grid, to coking coal, to gas or to process chemistry? | Clean power decarbonises neither clinker nor a blast furnace. |
| Geography | Is the site in a territory genuinely supplied with low-carbon electricity, with adequate grid and storage? | Gaps between provinces can be larger than national averages. |
| Proof | Can energy, inputs and emissions be traced to the product? | Without measurement and verification, a carbon advantage crosses neither procurement requirements nor regulatory borders. |
This grid leads to a simple conclusion: the most credible Chinese advantage will not come from a national miracle, but from industrial-energy corridors. The most promising zones combine a local energy resource, an electrifiable process, existing supply chains and the ability to prove product footprints.
Territories to watch: hydro South-West, renewable North-West, industrial coastline
The first candidate is the South-West, notably Yunnan and Sichuan. A 2025 study of provincial grid footprint factors estimates that between 2020 and 2022 their factors were more than 70% below the national average. That is a large enough difference to change the footprint of highly electro-intensive products.
Aluminium illustrates the mechanism almost textbook-style. Electrolysis requires very large volumes of electricity, so access to hydropower can radically alter the carbon intensity of the metal. Chinese production has already partly shifted to Yunnan. The strategy is not risk-free: droughts and pressure on the hydro resource have forced production cuts, a reminder that low-carbon electricity is not necessarily firm and unlimited electricity.
The second candidate is the North and North-West — Inner Mongolia, Ningxia, Gansu, Qinghai, Xinjiang — where the solar and wind potential identified by the IEA is concentrated. These regions could become platforms for electrolytic hydrogen, low-carbon ammonia, some photovoltaic materials, recycling and, in time, electrified metallurgical processes.
One seductive shortcut must be avoided: strong renewable potential does not equal a low-carbon product today. Parts of these regions still run largely coal-dependent power systems. Intermittency, grid limitations, storage and water availability can also constrain industrial use. The winner is therefore not the North-West in general: it is the site that verifiably links renewable sources, storage, flexible demand and a contract or connection that does not, in practice, rely on a captive coal plant.
Finally, the coastline — Jiangsu, Guangdong, Zhejiang, the Yangtze River Delta and the Greater Bay Area — does not necessarily have the least carbon-intensive electricity. It has different advantages: suppliers, ports, engineering, precision manufacturing, export markets and dense battery, power electronics, electric vehicle and solar chains. Its model will not be on-site generation, but the assembly of sophisticated industrial chains with contracted green electricity, interprovincial imports, distributed solar, offshore wind, storage and demand optimisation. Zero-carbon industrial parks are precisely the institutional laboratory of that combination.
| Industrial zone | Most plausible products | Carbon strength | Risk not to ignore |
|---|---|---|---|
| Yunnan / Sichuan | Aluminium, silicon, PV materials, metal recycling, battery segments | Historically low-carbon grids thanks to hydropower. | Drought, water-use trade-offs and seasonal intermittency. |
| Inner Mongolia / Ningxia / Gansu / Qinghai / Xinjiang | Hydrogen and ammonia, electro-intensive materials, solar, future DRI-EAF | Solar and wind resource, land, possible direct energy-industry coupling. | Current power mix, captive coal, congestion and the cost of firmness. |
| Jiangsu / Guangdong / Zhejiang | Batteries, electric vehicles, power electronics, grid equipment, recycling | Supply chains, outlets and fast industrialisation capacity. | The green attribute depends on traceability, not on a province's reputation. |
| Zero-carbon parks, several provinces | Production under strong export and traceability constraints | Energy, efficiency, circularity and carbon management can be designed together. | Heterogeneous standards and still incomplete verification. |
Aluminium can win quickly; steel only wins by changing process
Aluminium is the sector where Chinese electricity can most directly create a low-carbon competitive advantage. Chinese primary production is currently, on a national average, among the most emissive in the world, mainly because electricity and captive coal plants remain decisive. The 2025 international benchmark places Canada, Iceland and Brazil among the least intensive producers.
This does not contradict Yunnan's potential; it demands a finer comparison. A Chinese smelter with efficient cells, supplied by demonstrable hydropower and free of captive plants, can be less emissive than a Western smelter still supplied by coal or a very carbon-intensive grid. It should not, however, be presented as automatically better than the hydro-powered smelters of Quebec, Iceland or Norway. The competition will be plant against plant, not China against the West.
The most powerful lever is even simpler: secondary aluminium. According to the same benchmark, it cuts emissions by 90 to 95% compared with primary metal. A China that combined low-carbon electricity, scrap collection and efficient remelting could turn a volume advantage into a climate advantage — provided material flows become as traceable as electricity flows.
Steel is harder. China remains heavily dependent on the blast furnace-basic oxygen furnace route, and its sector carbon intensity is high compared with producers that use more scrap and electric arc furnaces. Green electricity helps, but it does not remove metallurgical coal or the CO₂ from reducing ore in a blast furnace.
Real scale-up runs first through more recycled steel in electric arc furnaces, then through direct reduction of iron ore with low-carbon hydrogen — DRI-EAF — for the volumes scrap cannot cover. The IEA stresses that access to very cheap renewable electricity is a condition of competitiveness for the hydrogen route. Here, China's North-West has a potential physical advantage; it does not yet have an acquired industrial one. Equipment, suitable ore, firm hydrogen, grids and commercial volumes remain to be demonstrated.
The lesson also applies to cement, clinker and part of heavy chemicals. Cleaner electricity lowers their indirect emissions, but does not solve calcination emissions, high-temperature fuels or fossil molecules used as feedstock. For these sectors a decarbonised grid is necessary but insufficient: materials must also be substituted, processes electrified where technically possible, clean fuels used and, for part of the residual emissions, carbon captured.
| Value chain | Effect of a cleaner grid | Chinese export outlook |
|---|---|---|
| Primary aluminium | Very strong: electrolysis is a major electricity consumer. | Concrete opportunity in the South-West, if hydropower, captive plants and process emissions are documented. |
| Recycled aluminium | Very strong, with an additional circularity advantage. | Major candidate for demanding markets if scrap is qualified and traceable. |
| Scrap-based EAF steel | Strong, but depends on scrap content and grid quality. | Gradual potential; no established national advantage yet. |
| Hydrogen DRI steel | Decisive, because hydrogen depends on renewable electricity. | Strategic North-West bet, still pre-commercial at scale. |
| Batteries, PV, power electronics | Important, mainly through lower manufacturing emissions and plant efficiency. | Likely advantage, but the balance must include imported metals and intermediates. |
| Cement and heavy chemicals | Partial. | A green industry promise based on the grid alone would be misleading. |
Exports to Africa and South-East Asia: climate benefit or offshoring?
The answer is that both are possible, often at the same time. A single trade policy can reduce use-phase emissions in one country and increase embodied emissions, extraction or captive generation elsewhere. The binary narrative of green dumping, like that of the pollution haven, has to be abandoned.
The first effect is positive and measurable. A Carbon Brief analysis estimates that China's 2024 exports of solar panels, batteries, electric vehicles and wind turbines required around 110 MtCO₂ of manufacturing in China but would avoid roughly 220 MtCO₂ per year abroad once the equipment is in service. Including announced exports and investments, the effect would eventually reach around 3% of sub-Saharan Africa's annual emissions. These results rest on usage and substitution assumptions: they do not remove the need to assess grid quality, real usage and equipment lifetime.
The second effect is the export of embodied carbon. A 2025 study using the Eora database for 2001–2016 concludes that China is a net exporter of embodied emissions to most countries along Belt and Road routes, with energy sectors and heavy industry as the main vectors. Another analysis of BRI trade stresses that trade between more and less efficient producers can either reduce or increase global emissions: everything depends on the intensity of the process that replaces the other.
It would be imprudent to conclude that Chinese exports to Africa or South-East Asia are necessarily more carbon-intensive. Input-output data are historical, aggregated and heterogeneous across products. They do establish one essential point: a product made in China can be a decarbonisation tool in use, while other flows — steel, cement, heavy equipment, chemicals — continue to carry a high carbon footprint.
| Flow or investment | Possible climate effect | Condition for credibility |
|---|---|---|
| Solar, wind, storage and grids | Emission reductions where the equipment displaces fossil generation. | Financing, connection, local maintenance and measurement of the generation actually substituted. |
| Electric vehicles and batteries | Use-phase benefit varies with the charging grid. | Parallel grid decarbonisation and transparency on nickel, graphite and cathodes. |
| Steel, cement, chemicals and heavy equipment | High risk of exporting embodied carbon. | Product declaration, low-carbon process, secondary materials and comparison with a realistic local alternative. |
| Chinese industrial investment | Can transfer clean skills and equipment, or lock in coal and heavy industry. | Assess energy, process, life-cycle emissions and local rules project by project. |
Indonesia provides the most important example for South-East Asia. Its nickel industrialisation attracts international investment, including Chinese groups, and aims to make the country a materials platform for stainless steel and batteries. But nickel processing parks rely largely on captive coal plants. In July 2024, Indonesia had 15.2 GW of captive coal capacity in operation; projects under construction, pre-permitted or announced brought the potential total to 26.24 GW.
That does not mean every Indonesian emission should be attributed to China. It demonstrates something else: regionalising a green value chain can move the upstream footprint from China to South-East Asia without reducing the global footprint of the battery or the steel. Laterite nickel processing is particularly energy-hungry; Brookings notes that producing class 1 nickel from these resources can emit two to six times more CO₂ than production from sulphide deposits, depending on the processing route.
Africa calls for an equally nuanced reading. A study of China-Africa trade concludes that effects can diverge: Chinese exports and some direct investment can lower emissions through technology transfer, while construction activity and certain resource-linked flows can raise them. Its data cover 2003–2014, so they indicate a research direction, not a verdict on any current project.
The new frontier: produce low-carbon, then prove it
A Chinese carbon advantage will only acquire global value if it is credibly measured. Zero-carbon parks matter precisely because they bring energy, storage, efficiency, circularity, buildings, logistics and carbon data into a single perimeter. But the label cannot become a trade passport in itself. Analysts still point to the diversity of standards, weaknesses in some verification arrangements and the difficulty of harmonising accounting methods across parks.
For a buyer of metals, batteries, solar materials or electrical equipment, five proofs will soon be more useful than a generic label:
- A product emission factor with a clear boundary covering electricity, fuels, process reactions and essential inputs.
- Evidence of electricity supply, ideally geolocated and time-stamped, distinguishing average grid, purchase contract, dedicated plant and any captive generation.
- Material traceability, in particular for scrap, alumina, bauxite, nickel, graphite, silicon and semi-finished steel.
- Independent verification, with a method compatible with customer market requirements rather than an unverifiable internal calculation.
- A functional comparison confronting the same product, same quality, same boundary and same process with its Western or local alternative.
“A warning for buyers and regulators: missing traceability must not be filled with a provincial average or a green energy promise. For electro-intensive products, captive coal, the origin of inputs and the time resolution of electricity supply can change the result more than the label Chinese or Western.”
Conclusion: a competition between sites, not flags
China's electricity trajectory creates a historic possibility: turning part of the country's manufacturing power into a lever for global decarbonisation rather than a simple displacement of emissions. The hydro South-West can produce aluminium and electro-intensive materials that are highly competitive on carbon. The solar and wind North-West can become a base for hydrogen, ammonia and, later, deeply electrified metallurgy. The coastline can convert its supply chain advantage into a clean product advantage, provided it secures and proves low-carbon electricity.
But the possibility guarantees nothing. On national averages, Chinese aluminium and steel remain more carbon-intensive than the best global producers. Captive plants, metallurgical coal, process emissions, hydrological constraints and the export of upstream stages to South-East Asia can slow — or contradict — the promise of clean industry.
The most fruitful question for the 2030s is therefore not whether China will overtake the West in green industry. It is: which value chains will genuinely be cleaner, on which site, with which electricity, which materials and which proof? The new industrial geography of carbon will be decided at that scale, far more than at the scale of national slogans.
Editor's note: 2030, 2055 and 2060 figures are presented as scenarios or public targets, not as forecasts. Input-output estimates of embodied carbon are historical and aggregated, and should be used to frame due diligence questions rather than to judge an individual supplier.
Frequently asked questions
References
- Government of China — China targets clean, low-carbon new energy system by 2030
- State Council — China issues action plan for carbon peaking during the 15th Five-Year Plan period
- Government of China — China unveils five-year plan for renewable energy development
- Ember — China electricity data and 2025 review
- IEA — An energy sector roadmap to carbon neutrality in China
- Wu et al. — Decarbonizing China's grid: provincial grid carbon footprint factors and export-embedded electricity emissions, 2020–2060
- Transition Asia — The Chinese Aluminium Sector: challenges and opportunities for decarbonisation
- Dialogue Earth — Behind China's boom in zero-carbon industrial parks
- RMI — Accelerating China's Green Transition Through Zero-Carbon Industrial Parks
- IEA — Iron and Steel Technology Roadmap
- RMI — Pursuing Zero-Carbon Steel in China
- Global Efficiency Intelligence — Aluminum Climate Impact 2025
- Global Efficiency Intelligence — Steel Climate Impact 2025
- Carbon Brief — China's clean-energy exports in 2024
- Jiang, Mukhopadhaya & Zhang — Carbon emissions embodied in China's manufacturing exports under the BRI
- Li et al. — Will China-Africa trade increase Africa's carbon emissions?
- Li & Khan — Quantifying emissions embodied in BRI trade
- CREA & Global Energy Monitor — Indonesia's captive coal on the uptick
- University of Maryland — Mining, Manufacturing, and Markets: Indonesia's EV industry
- Brookings — Indonesia's electric vehicle batteries dream has a dirty nickel problem