
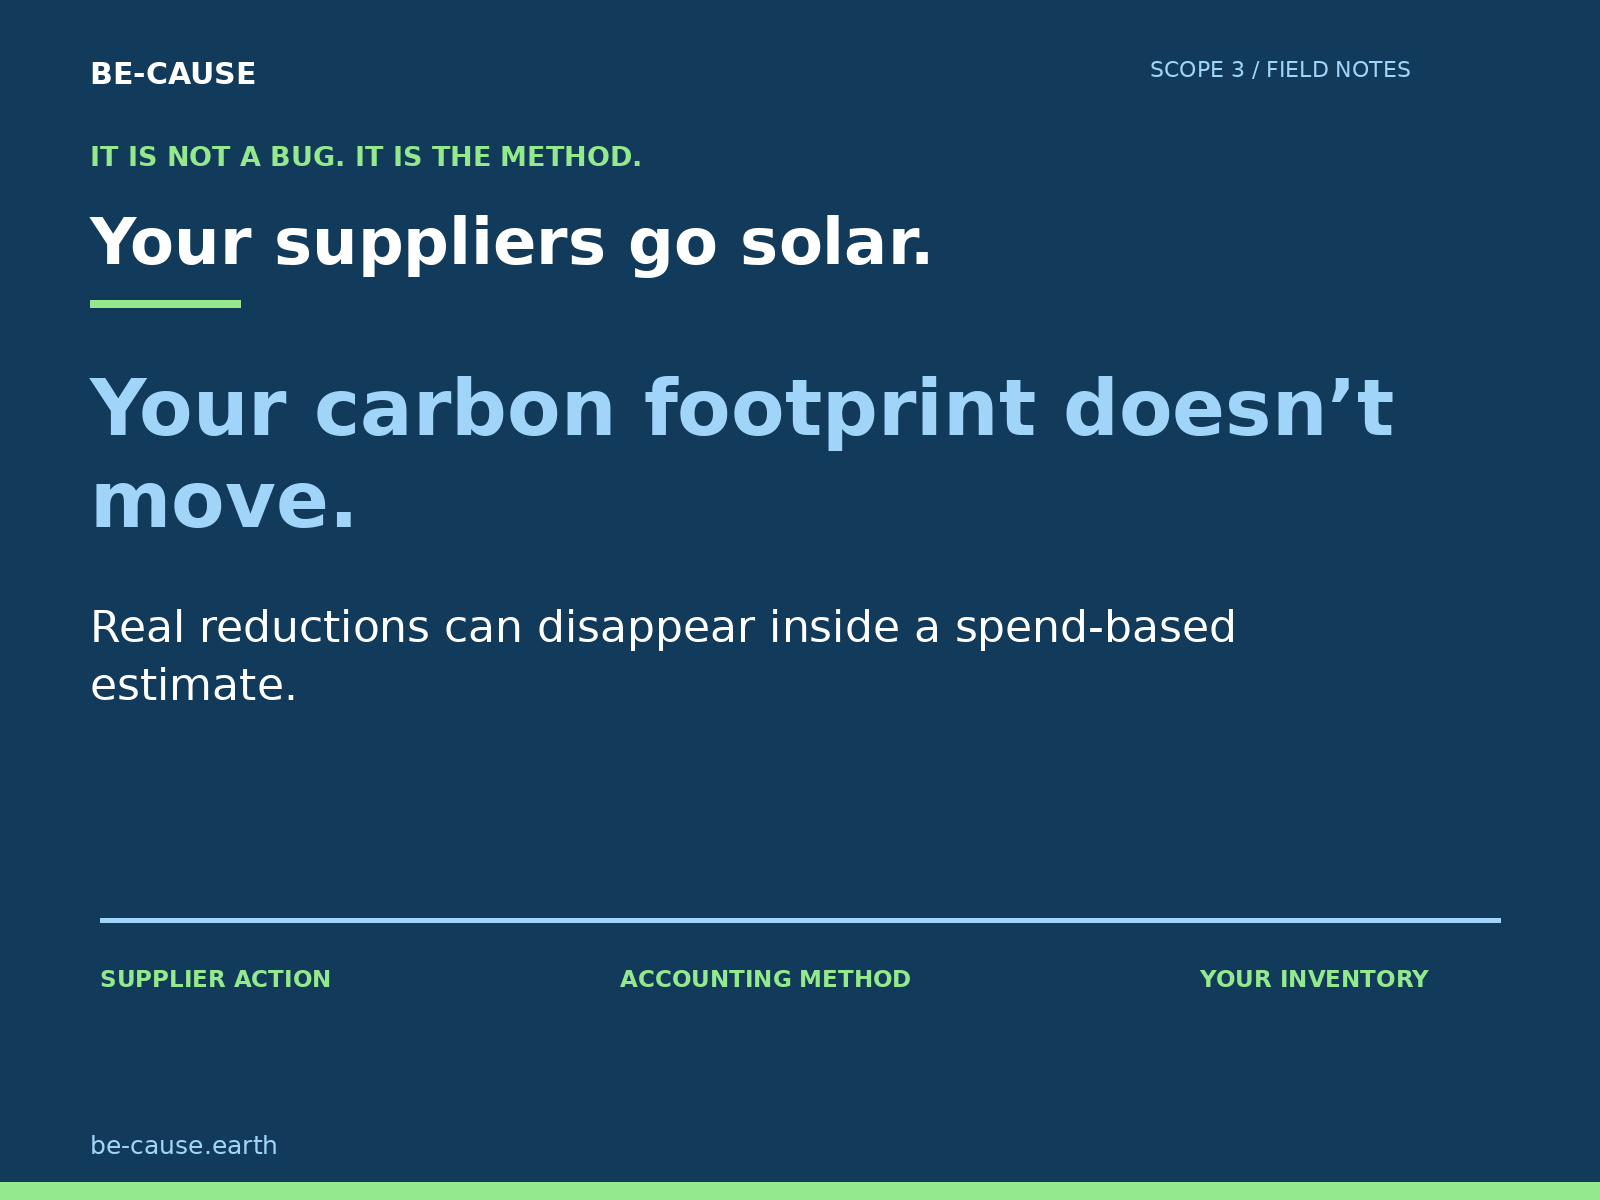
Your supplier installs solar panels. Its electricity-related emissions fall. You update your carbon inventory, and your purchased-goods footprint barely changes—or does not change at all. It is not necessarily a bug. It may be the method.
A spend-based estimate sees how much you buy and the average emissions of a sector. It does not directly see what changed inside one factory. Meanwhile, the biggest emissions in your product may sit further upstream, in the materials that factory purchases. These are two different problems: where the emissions sit, and whether your accounting can detect a reduction.
1. The emissions you cannot see from your own factory
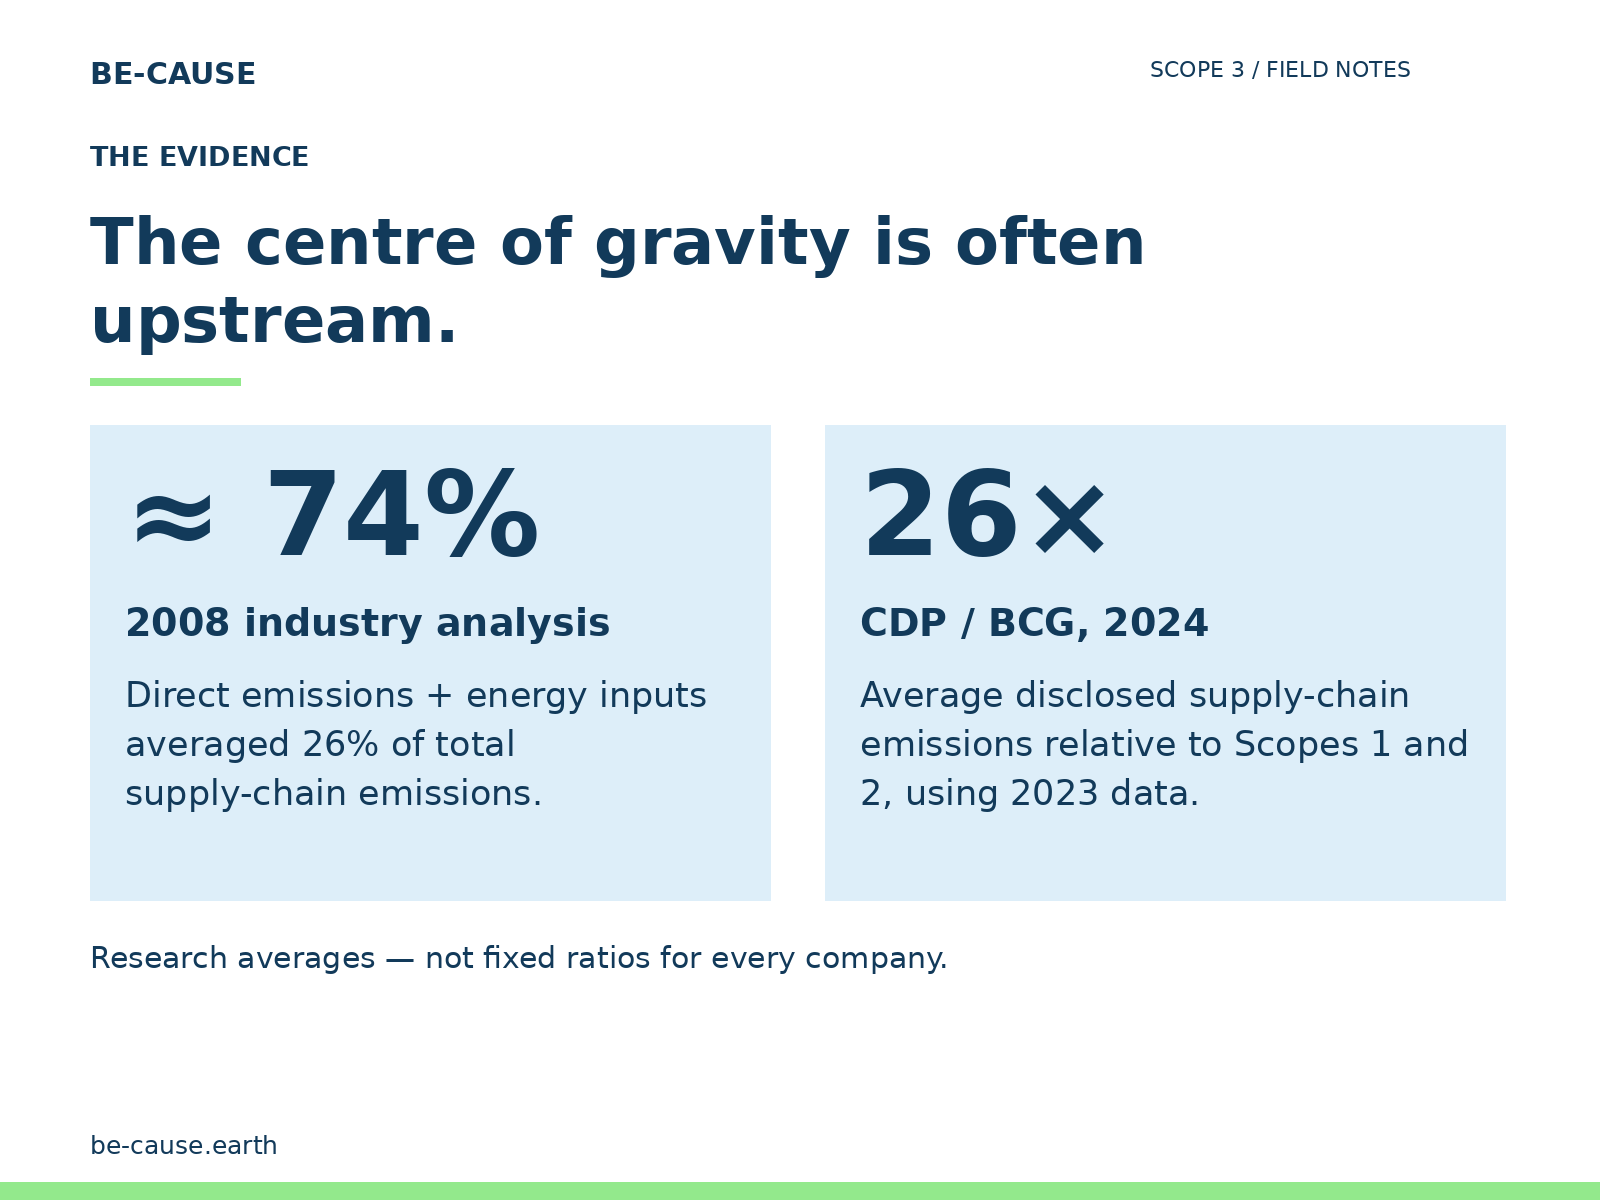
In manufacturing supply chains, limiting the assessment to your own fuels and purchased energy can leave out much of the footprint. Matthews, Hendrickson and Weber demonstrated the boundary problem in 2008. Across their industry analysis, direct emissions plus energy inputs averaged 26% of total supply-chain emissions: roughly 74% remained outside that boundary. This is an industry-level finding, not a universal ratio for every business.
CDP and BCG found a similar strategic imbalance in disclosed data. Their 2024 report states that corporates reported supply-chain Scope 3 emissions averaging 26 times their operational Scope 1 and 2 emissions in 2023. Again, this is an average across the reporting data—not a multiplier to apply to your company.
Hertwich and Wood’s 2018 global input–output analysis reinforces the importance of upstream emissions. But an economy-wide finding cannot tell an individual buyer which supplier or material to change. It tells you why stopping at the factory gate is insufficient.
2. Your supplier’s factory is part of your Scope 3
The mechanism is simple, with one important boundary. The emissions attributable to making the goods and services you purchase enter your Scope 3, generally Category 1: purchased goods and services. This includes upstream cradle-to-gate emissions, except those reported under another Scope 3 category.
Your supplier’s fuels are its Scope 1. Its purchased electricity is its Scope 2. The share attributable to your purchased product can become part of your Category 1 footprint. The materials it buys also bring upstream emissions into that product. You do not copy the supplier’s entire corporate inventory into yours: you need a product boundary and a defensible allocation.
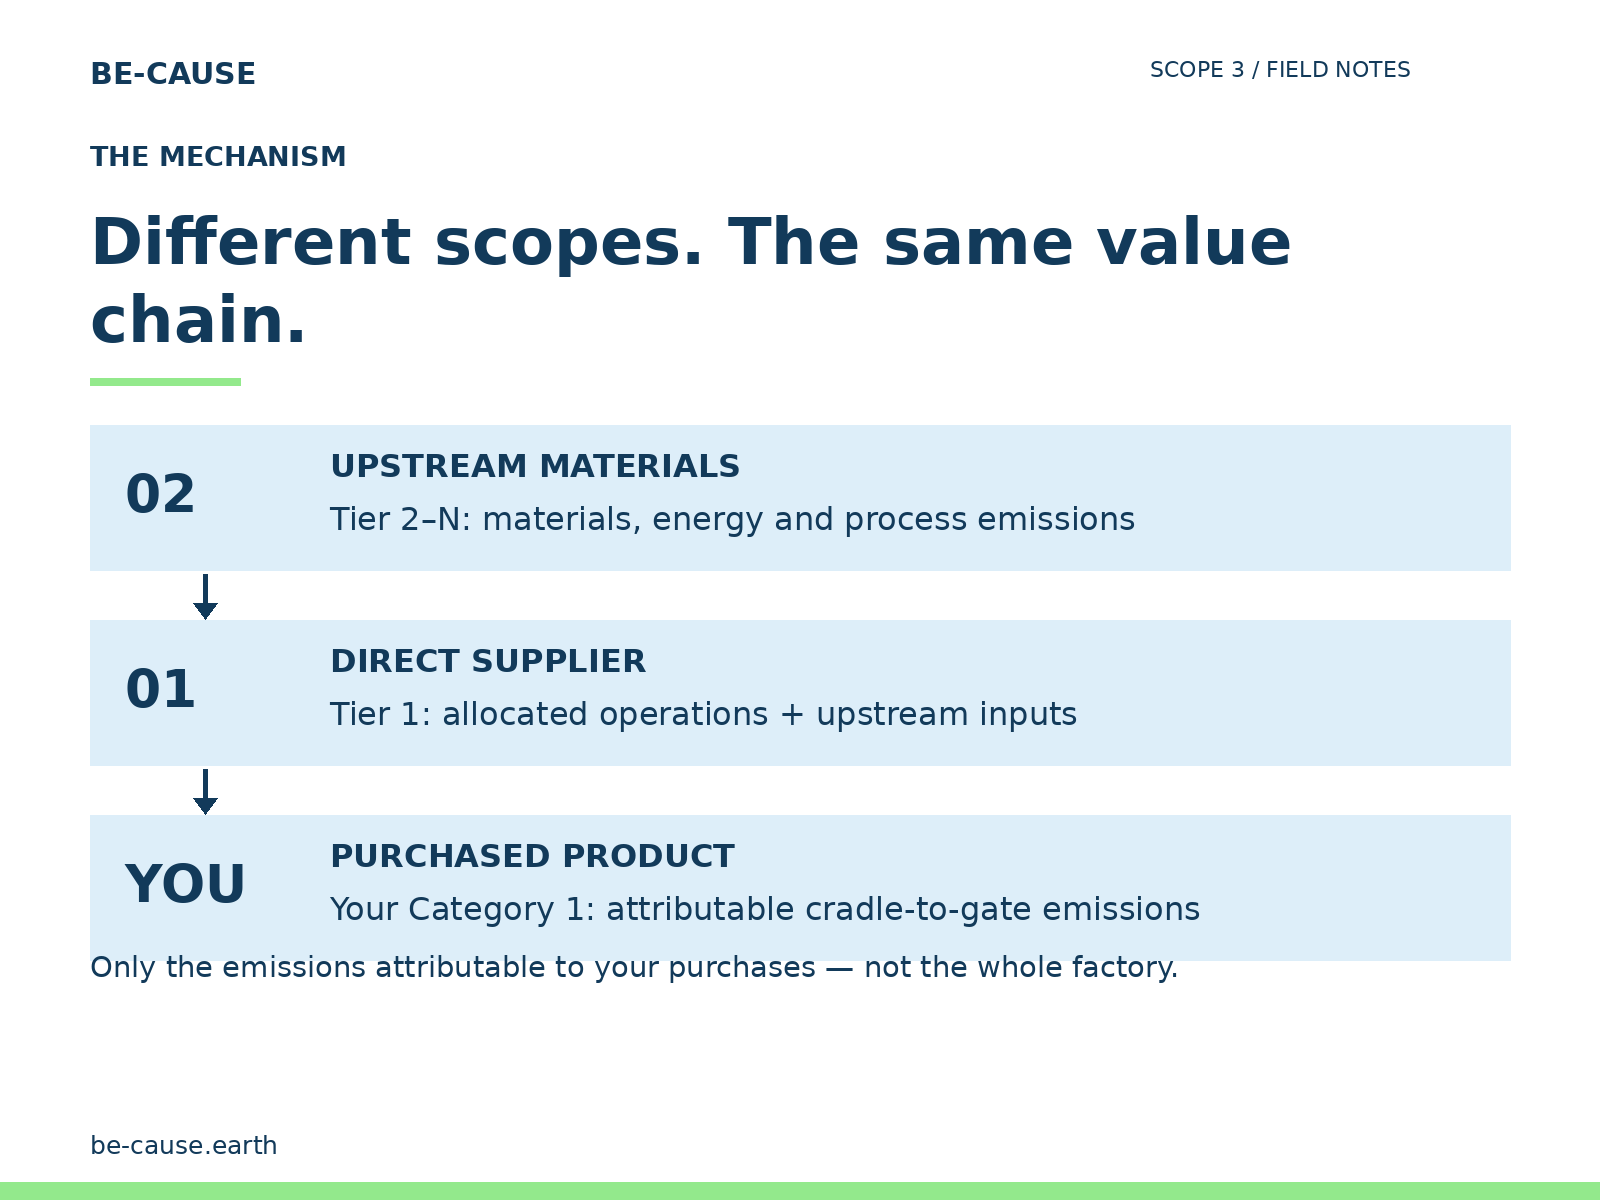
The same physical emissions may appear in different companies’ inventories under different scopes. That overlap is expected across the value chain. It is not a reason to count the same emissions twice inside your own inventory.
3. Green electricity at Tier 1 is a start—not always the main lever
An assembly workshop may use relatively little energy compared with the embodied emissions of its purchases. Steel, aluminium, plastics and synthetic fibres carry extraction, processing and energy emissions from earlier stages. A solar installation at the final assembly site cannot remove the emissions already embodied in those inputs.
The conclusion is not that supplier electricity is unimportant. It is that its importance must be tested against the complete product footprint. For primary aluminium, electricity-intensive electrolysis makes power a major lever. In semiconductor manufacturing, electricity matters alongside process gases, materials and other production inputs. Across electronics, the balance varies by component and process.
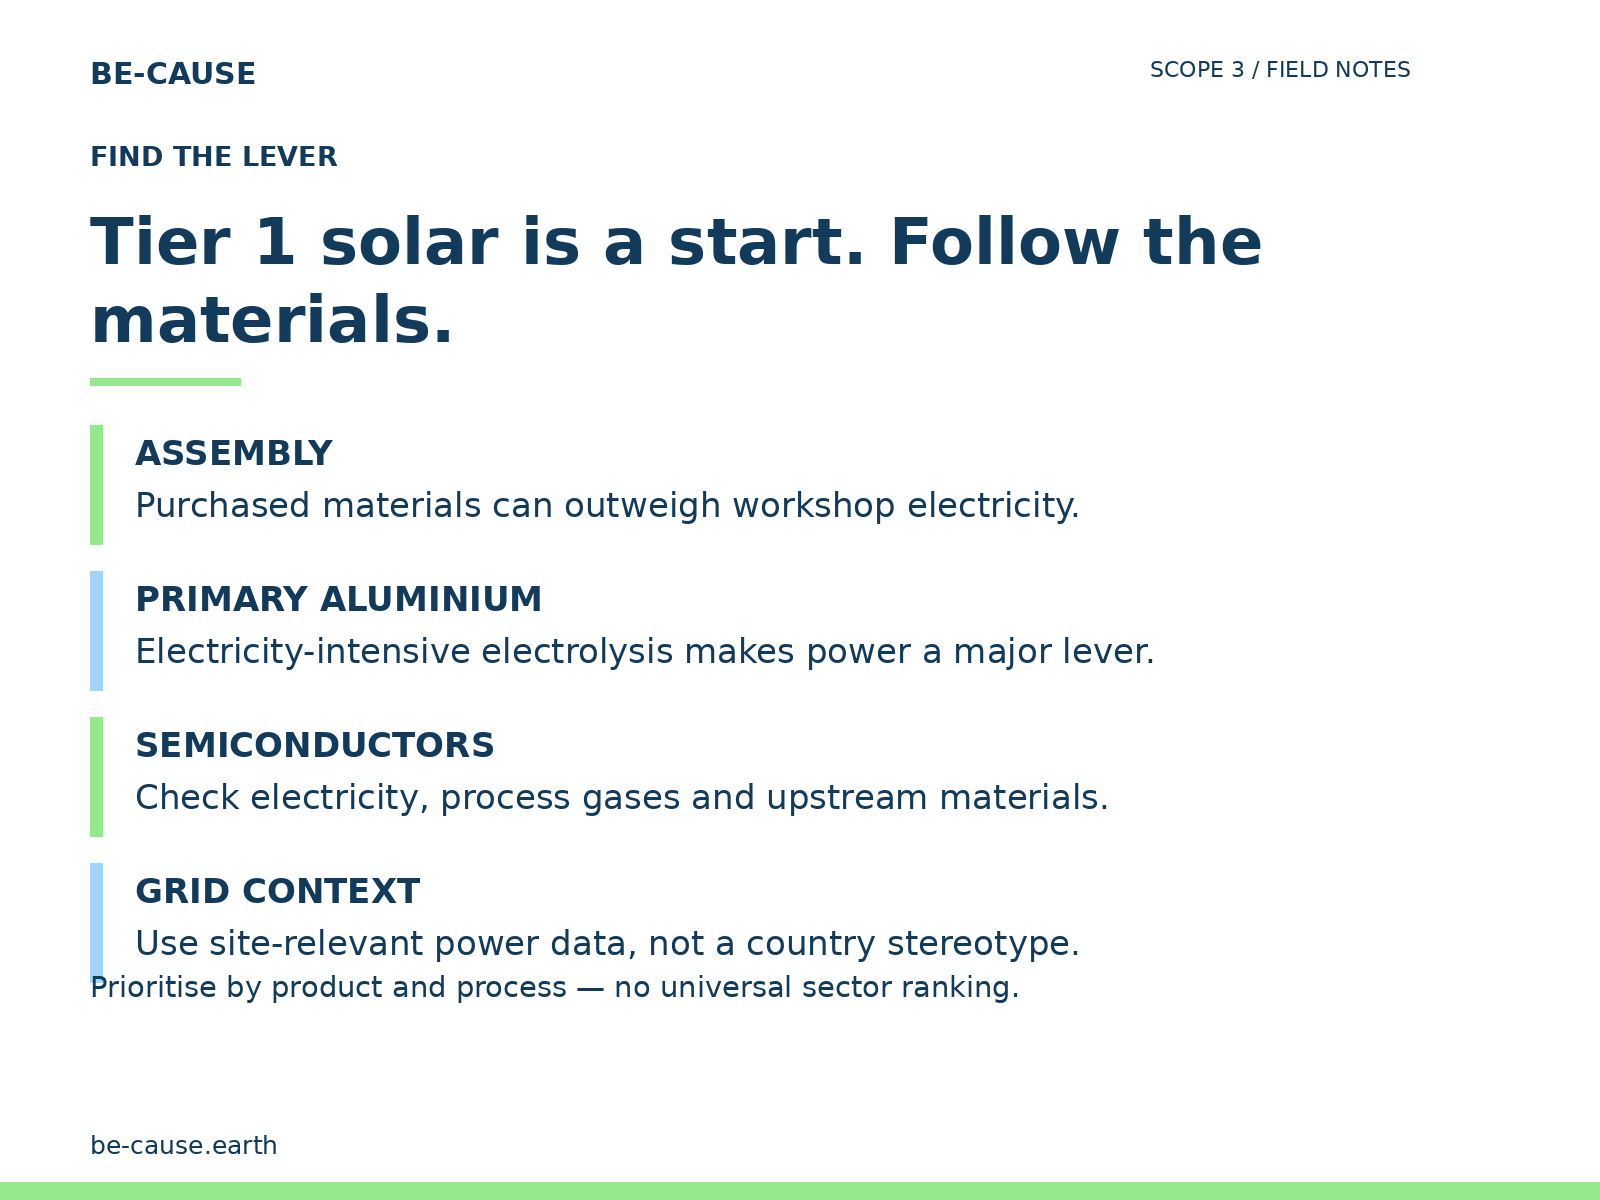
Grid context also matters. For China-linked suppliers, identify the actual site, relevant grid and electricity procurement evidence. Do not assume every Chinese factory has the same factor, or that a certificate alone demonstrates the reduction attributable to your product. Check the applicable accounting approach and avoid double claiming electricity attributes.
For energy producers, transport operators and many energy-intensive processes such as cement, glass and primary steelmaking, direct operations deserve serious attention. For assemblers and brands, upstream purchases often dominate. Even these distinctions are starting hypotheses: process routes, product mix and inventory boundaries decide the actual priorities.
4. The spend-based trap: real progress can stay invisible
Spend-based accounting multiplies expenditure by an economic, sector-average emission factor. It can be useful for an initial screening when activity data is unavailable. But if spend and the selected factor remain unchanged, installing solar or improving efficiency at a particular supplier is not directly detected by that calculation.
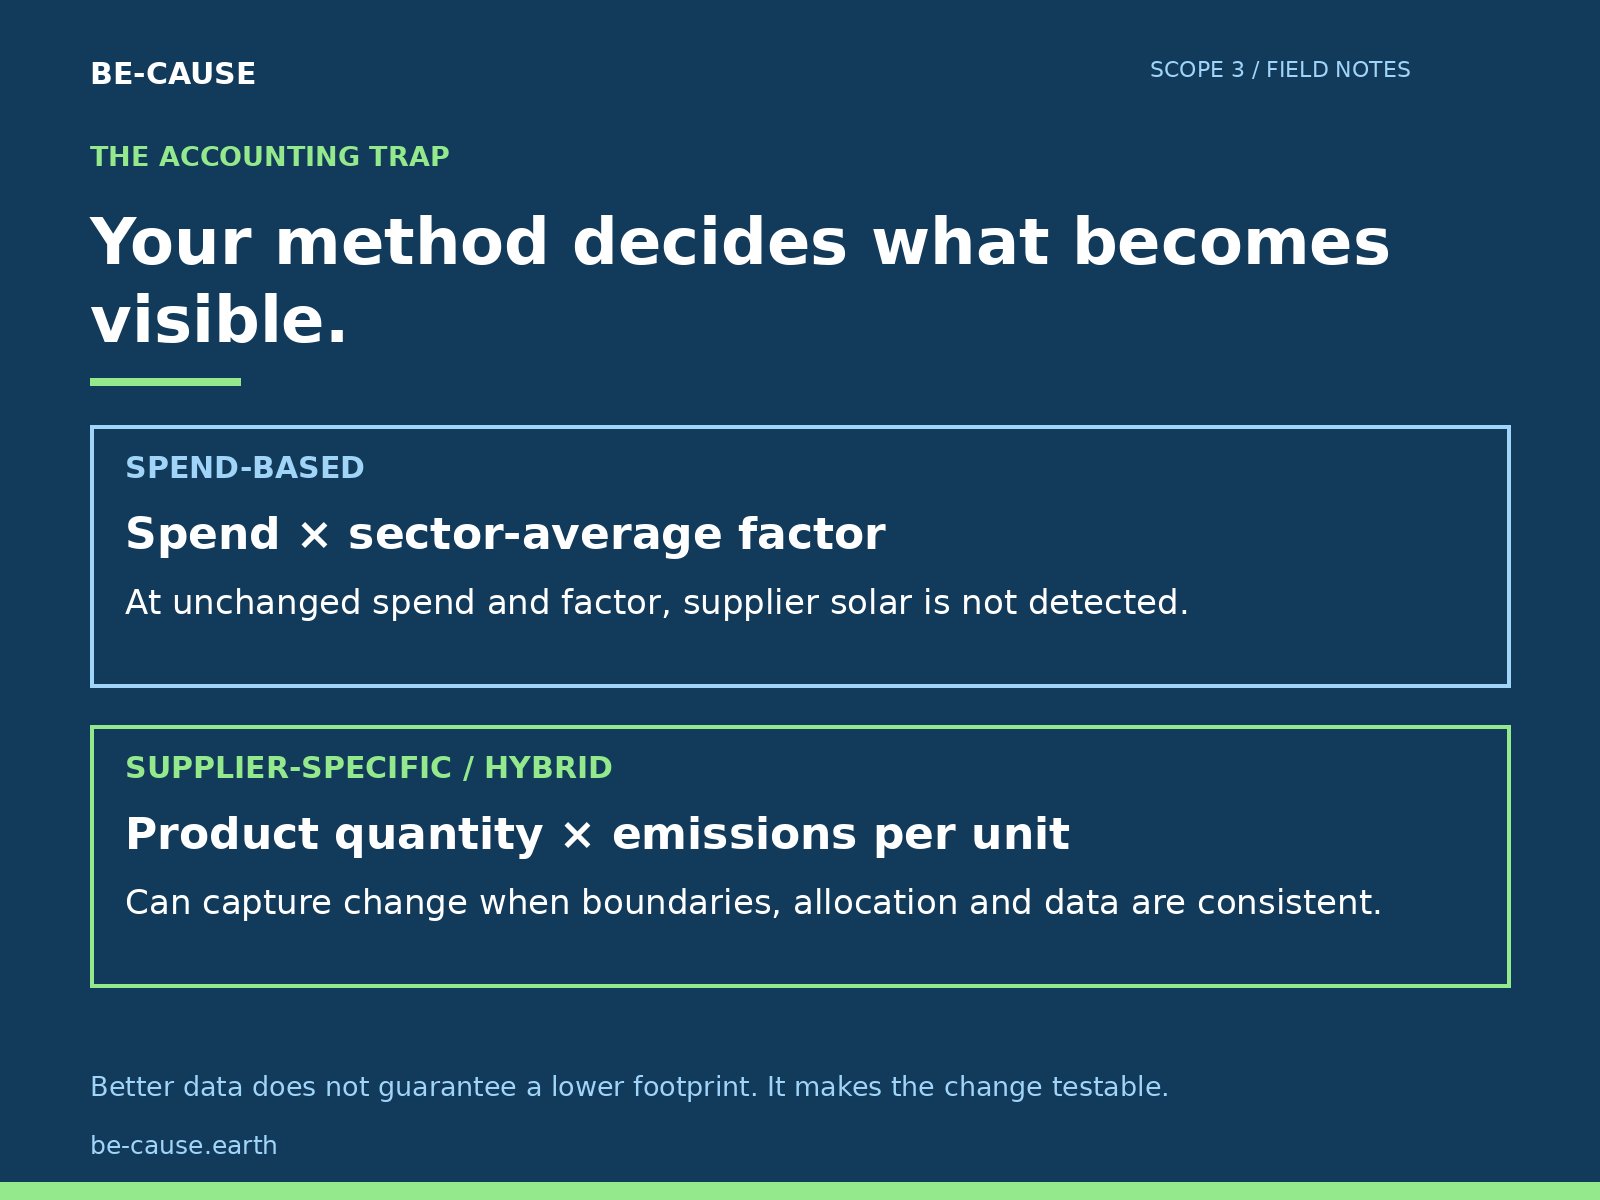
The number can still move because prices, purchase volumes, inflation treatment or the factor database change. Those movements are not necessarily physical decarbonisation. Conversely, a real supplier improvement can be hidden by a static sector average.
| Method | What it sees | What to watch |
|---|---|---|
| Spend-based | Expenditure × economic sector factor | Price effects; no direct detection of a specific factory improvement. |
| Average-data | Physical quantity × average material or product factor | More activity detail, but still not necessarily the supplier’s actual performance. |
| Supplier-specific | Supplier-provided product cradle-to-gate data | Boundary, allocation, completeness, reporting period and evidence quality. |
| Hybrid | Allocated supplier operations combined with upstream activity and secondary data | Gaps and overlaps between components; consistent methods year to year. |
Supplier-specific and hybrid methods can capture changes when the data actually covers the improvement and is attributable to your purchases. A revised footprint may initially rise because better data reveals omitted emissions. That is better visibility, not automatically worse performance. Keep the baseline and reporting method comparable, and explain material methodological changes.
5. Five checks before your next supplier carbon campaign
- Locate the hotspot: split purchased-product emissions between materials, energy and processes before choosing a lever.
- Follow the material: identify the relevant Tier 2 and Tier 3 producers, not only your commercial Tier 1 contact.
- Ask for usable evidence: quantities, product boundaries, production route, site energy, allocation and reporting year.
- Test the method: can your current calculation reflect the proposed supplier improvement, or does it still use a generic factor?
- Compare like with like: separate procurement volume, price and methodology effects from physical emissions changes.
Start with a priority product and a manageable supplier cohort. You do not need perfect primary data everywhere before acting. Use screening to choose where better evidence changes a purchasing decision, and improve that evidence deliberately.
6. Where the market tools fit—and where they stop
| Layer | Examples | Role in this problem |
|---|---|---|
| Ratings and responsible sourcing | EcoVadis; Sedex | Assessments and supplier information; not a substitute for an attributable product footprint. |
| Disclosure and targets | CDP; SBTi | Disclosure and target frameworks; the buyer still needs implementation evidence. |
| Carbon accounting | Watershed; Persefoni; Sweep; Normative; Sphera | Inventory and calculation capabilities; sensitivity depends on the inputs and method used. |
| Verification | SGS; TÜV SÜD; Bureau Veritas | Verification within the agreed scope; check what the engagement actually covers. |
| Supplier ecosystem steering | BE-CAUSE Net Zero Pulse | Portfolio-level maturity and data screening to prioritise suppliers, gaps and development needs. |
| Whole-company supplier development | BE-CAUSE SSDP | Assessment involving up to 10 roles, from board to shop floor: align commercial ESG commitments, management decisions and operational execution. |
BE-CAUSE is a supplier development partner, not a rating agency or a replacement for your carbon platform. Net Zero Pulse and SSDP are positioned as the cross-industry execution layer, designed to cost less than the administrative time and energy already spent chasing questionnaires, cleaning factors and re-explaining boundaries—and to move faster than another questionnaire cycle. The logic transfers across textiles, food, chemicals, electronics, packaging and automotive supply chains. Net Zero Pulse steers the supplier ecosystem; SSDP tests whether commitments are genuinely deployed on the shop floor, beyond paperwork and AI-filled forms.
7. Measure what matters
- Your operational footprint is only one part of the decision. Locate the centre of gravity across the value chain.
- Tier 1 green electricity is a good start. Test whether materials and deeper tiers offer a larger lever.
- A spend-based inventory is a screening tool—not proof that a supplier’s efforts did or did not work.
- Supplier-specific evidence makes reductions visible only when boundaries, allocation and comparison are sound.
“Measuring what is easy is not measuring what matters.”
Over to you: are your priority purchases still measured through spend, or through supplier and product data? Use the readiness check below to start the conversation about the evidence your value chain can actually produce.
Questions fréquentes
Références
- Matthews, Hendrickson & Weber (2008), The Importance of Carbon Footprint Estimation Boundaries, Environmental Science & Technology.
- Carnegie Mellon University (2008), An Accurate Footprint: interpretation of the industry boundary study.
- Hertwich & Wood (2018), The growing importance of scope 3 greenhouse gas emissions from industry, Environmental Research Letters.
- CDP & BCG (2024), supply-chain Scope 3 emissions average 26 times operational emissions, based on reported 2023 data.
- GHG Protocol, Category 1: Purchased Goods and Services—Technical Guidance for Calculating Scope 3 Emissions.
- GHG Protocol, Scope 2 Guidance: electricity accounting and contractual instruments.
- SEMI Semiconductor Climate Consortium (2024), Scope 3 Category 1 GHG guidelines.
- Related BE-CAUSE analysis: Scope 3 anatomy across L’Oréal, Stellantis and Levi’s.
- Related BE-CAUSE service: Tier-N supply-chain mapping.
- BE-CAUSE Net Zero Pulse: supplier ecosystem screening and steering.