

By Emmanuel Delplanque, Co-Founder & CEO, Be-Cause
China is the world's largest producer and consumer of electricity. In one generation, its power system grew seventeen-fold, lifted hundreds of millions out of poverty — and locked in a coal-heavy backbone that still casts a long shadow over global climate accounting. But the next three years (2026–2028) will mark a historic inflection: for the first time, the entirety of China's new electricity demand is set to be covered by decarbonized sources, opening the absolute decline of coal in the power sector. This article decodes the trajectory of China's energy mix from 1990 to 2035 and what it means for any company exposed to Chinese supply chains.
Executive summary
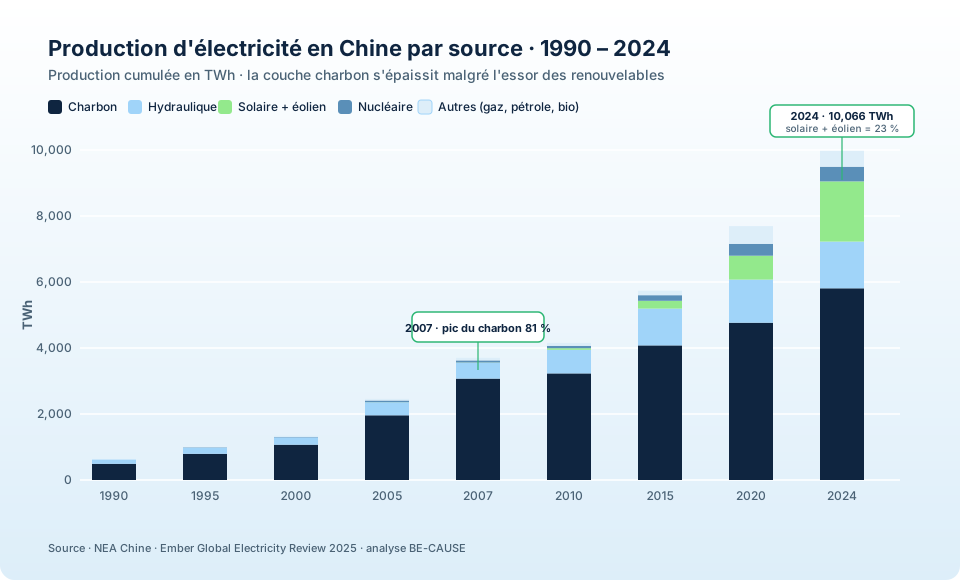
- China's electricity production grew from 621 TWh in 1990 to over 10,066 TWh in 2024 — a 17× increase in 34 years.
- The coal paradox: relative share has fallen from a 2007 peak of 81% to 58% in 2024, but absolute coal-fired generation kept rising to 5,864 TWh.
- Tipping point: in 2024, 81% of demand growth was covered by clean energies (renewables + nuclear), vs only 18% by coal.
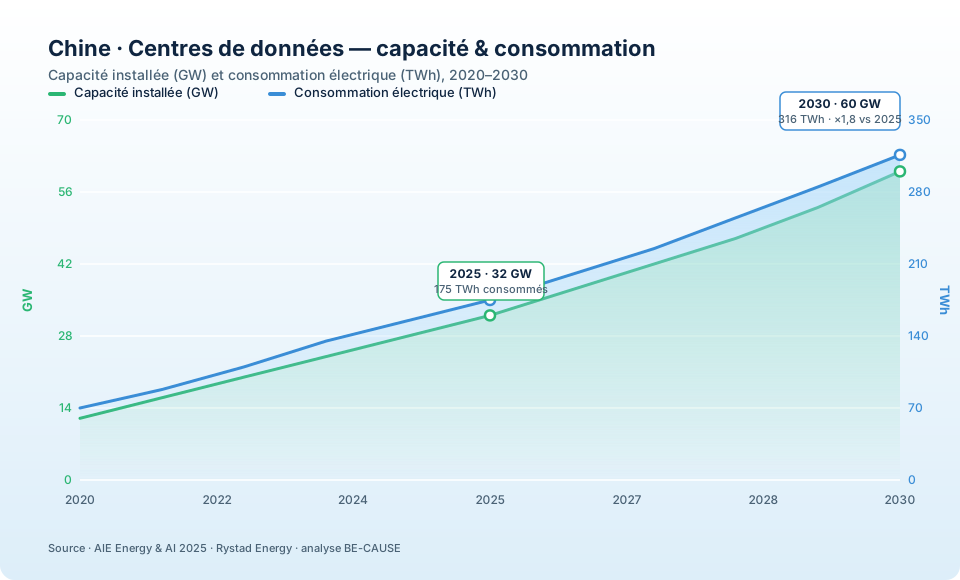
- AI and data center electricity consumption will more than double by 2030 to ~316 TWh — yet AI still accounts for less than 0.5% of China's primary energy demand.
- By 2030, clean energy reaches ~59% of the mix; by 2035, solar + wind together overtake coal in absolute production volume.
- Cost parity is already won: solar + wind + storage now beat new coal plants on LCOE, making fossil fuels economically obsolete for new capacity.
The coal paradox: a declining share, a rising volume
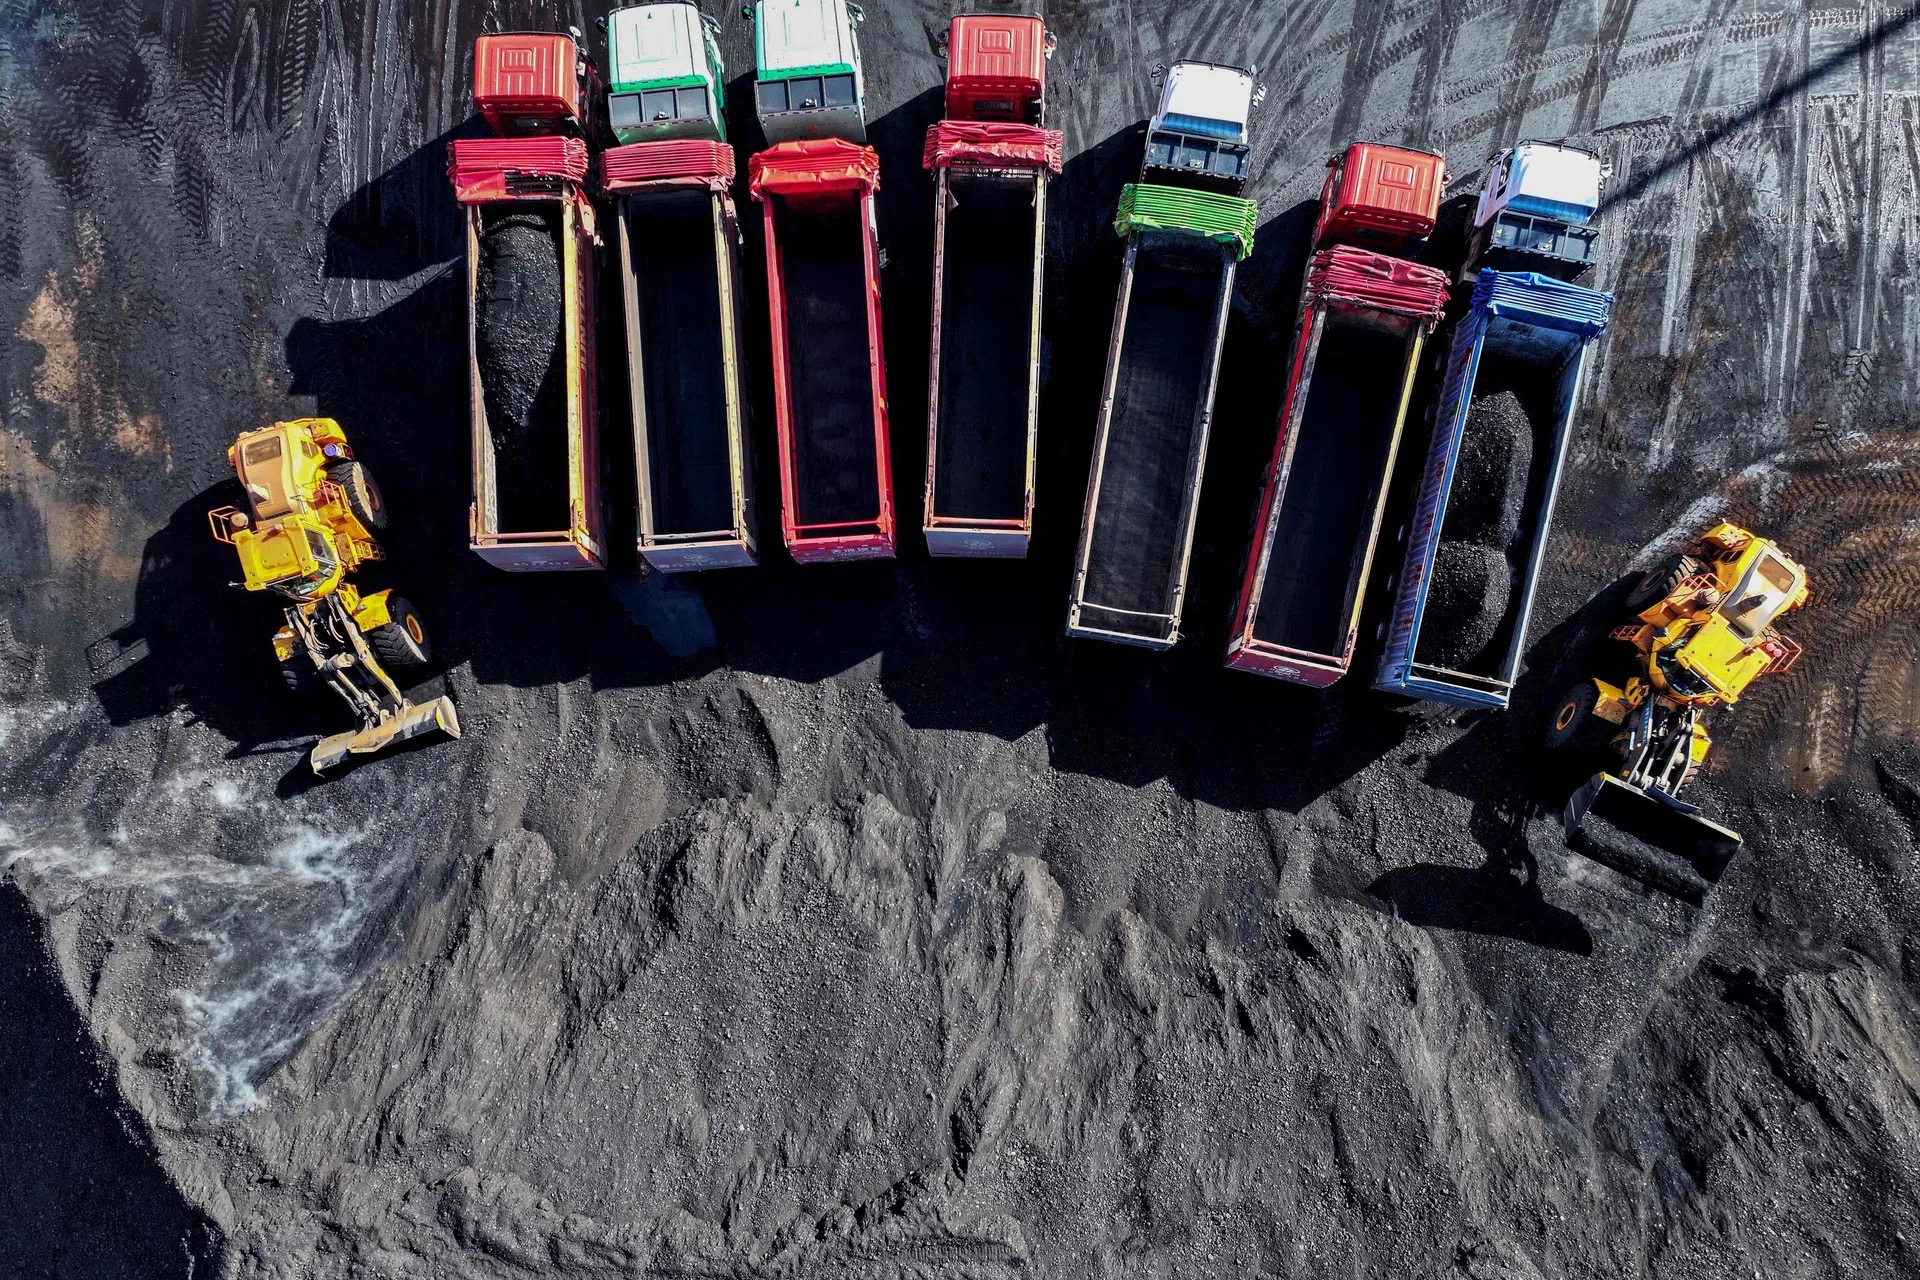
Between 1990 and 2024, Chinese electricity production multiplied by 17. Coal underwrote that growth: its share peaked at 81% of the mix in 2007 — the year China entered a decade of double-digit GDP growth post-WTO accession. Since then, the share has steadily declined to 58.3% in 2024. And yet absolute coal volumes kept climbing: 496 TWh in 1990, 3,100 TWh at the 2007 share peak, 5,864 TWh in 2024. China today accounts for 55% of the world's coal-fired electricity.
This is the coal paradox: relative decarbonization can coexist with absolute fossil expansion when total demand grows faster than clean energy can be deployed. For ESG, CBAM and Scope 3 reporting, this distinction is critical. A buyer sourcing from China cannot rely on the national mix percentage alone — the carbon intensity of every additional kilowatt-hour above the renewable build-out has been, until now, almost entirely coal.
| Period | Key event | Impact on the mix |
|---|---|---|
| 1990–2000 | Sustained economic growth | Coal dominant (77% in 2000) |
| 2001–2008 | WTO entry, industrial boom | Production doubled, coal peaks at 81% (2007) |
| 2009–2015 | Renewable energy development plans | Rise of hydro, start of wind |
| 2016–2020 | Climate targets, Paris Agreement | Take-off of solar PV |
| 2021–2025 | 14th Five-Year Plan | Explosion of solar/wind, coal drops below 60% |
| 2026–2030 | 15th Five-Year Plan | Clean energy covers 100% of new demand |
The 2026–2028 tipping point
Three forces converge to make 2026–2028 a structural inflection. First, scale: in 2024 alone, China added 373 GW of new renewable capacity — 86% of all new power capacity installed in the country — bringing installed solar to 887 GW (+45% YoY) and wind to 521 GW (+18%). Second, economics: the levelized cost of solar + wind paired with batteries has fallen to USD 54–82/MWh in resource-rich regions, undercutting USD 70–85/MWh for new Chinese coal plants. Third, policy: the 15th Five-Year Plan (2026–2030) removes guaranteed feed-in tariffs and forces wind and solar to compete in merchant markets via PPAs and contracts for difference.
The result: in 2024, 81% of the growth in Chinese electricity demand was already met by clean energies, against only 18% by coal. Once that figure reaches 100% — projected within this 2026–2028 window — absolute coal generation in the power sector begins to fall. This is the first time China's energy system has been able to grow without burning more coal to do so.
The shift toward renewables: solar, wind and the nuclear surge
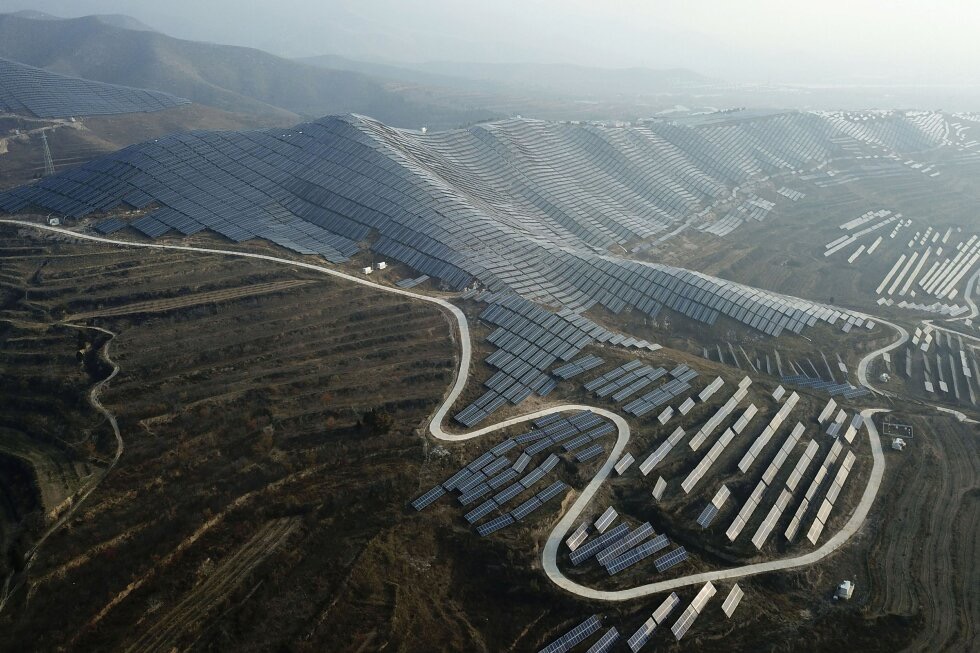
The pace of renewable deployment in China has no historical equivalent. Installed solar capacity grew from 175 GW in 2019 to 887 GW at end-2024, a 5× expansion in five years. Wind followed a similar curve, from 210 GW to 521 GW. In 2024 alone, China installed 277 GW of new solar PV (more than the entire installed solar fleet of the United States), 80 GW of onshore wind, and 16 GW of offshore wind. The country now hosts more than 60% of the world's operating solar capacity and over 45% of global wind capacity.
Behind these headline numbers, three structural shifts matter for buyers and ESG teams. First, the industrial base is fully vertically integrated — China manufactures more than 80% of global polysilicon, wafers, cells and modules, which means cost reductions feed directly back into domestic deployment. Second, storage is finally catching up: 73 GW / 168 GWh of grid-scale batteries were installed by end-2024 (vs. 31 GW the year before), enabling renewables to provide firmer capacity. Third, the country's ultra-high-voltage (UHV) transmission backbone — over 40 UHV lines totalling more than 30,000 km — physically connects Western generation to Eastern load centers, breaking the geographic mismatch that historically constrained renewable absorption.
The nuclear program: a third decarbonization pillar
Less visible than solar and wind, China's nuclear program is the single most ambitious civil nuclear build-out in history. As of early 2026, 57 reactors are in commercial operation (~60 GW installed) and 35 reactors are under construction (~38 GW) — meaning China is building roughly as many reactors as the rest of the world combined. The State Council approved 10 new reactors in 2024 and again in 2025, the highest annual approval cadence ever recorded globally.
The official trajectory targets 110 GW by 2030, 200 GW by 2040 and 335 GW by 2050. At that pace, China commissions roughly one reactor every month from the mid-2030s onwards and overtakes the United States to become the world's largest nuclear producer before 2030. Critically, the technology mix is also evolving: the domestically developed Hualong One (HPR1000) Generation III+ design is now the workhorse, while the Shidao Bay HTR-PM high-temperature gas-cooled reactor — the world's first commercial Gen IV plant — has been grid-connected since December 2023, and 12 small modular reactors (SMRs) are in pilot deployment, including the ACP100 'Linglong One' on Hainan Island.
For Scope 2 accounting, nuclear matters disproportionately. With an emission factor below 12 g CO₂/kWh and capacity factors above 90%, every additional GW of nuclear displaces roughly 6 TWh of coal-fired generation per year — equivalent to about 5 Mt CO₂ avoided annually per reactor. The 50 GW of additional nuclear capacity planned by 2030 alone would therefore avoid around 250 Mt CO₂ per year — close to the total annual emissions of Spain.
Dynamics of net electricity demand: electrification as the key KPI
Looking only at the supply side hides the more important transformation: the structure of demand itself is shifting. Total Chinese electricity consumption reached 9,920 TWh in 2024, up 6.8% year-on-year — well above the 5.0% GDP growth rate. This widening gap between electricity demand growth and GDP growth is the single most important KPI to monitor, because it reveals the underlying electrification of industry, transport and buildings.
| Year | Electricity demand growth | GDP growth | Electrification ratio* |
|---|---|---|---|
| 2020 | +3.1% | +2.2% | 1.41 |
| 2021 | +10.3% | +8.4% | 1.23 |
| 2022 | +3.6% | +3.0% | 1.20 |
| 2023 | +6.7% | +5.2% | 1.29 |
| 2024 | +6.8% | +5.0% | 1.36 |
| 2025e | +6.0% | +4.8% | 1.25 |
* Ratio of electricity demand growth to GDP growth. A value above 1 indicates that the economy is electrifying faster than it is growing. Source: NEA, NBS, IEA, BE-CAUSE analysis.
Where the new kilowatt-hours actually go
Three demand pools explain the gap. (1) Electric vehicles: 31 million NEVs on Chinese roads at end-2024 — more than half the world fleet — drawing roughly 180 TWh per year and growing 35% annually. (2) Heat pumps and industrial electrification: an estimated 95 TWh per year already substitutes coal- or gas-fired heat in textiles, food processing and chemicals. (3) Data centers, AI and 5G infrastructure: 175 TWh in 2025, projected at 316 TWh by 2030. Together, these 'new electrification' demands accounted for more than 60% of incremental electricity consumption in 2024.
Impact on steel, glass and cement
The hardest-to-abate industries — steel, cement and glass — together represent close to 30% of China's industrial CO₂ emissions and are now central to the electrification agenda. Each is at a different point on the curve:
- Steel: China produces ~1,005 Mt of crude steel per year (54% of the world). Only ~10% is currently electric-arc furnace (EAF) using scrap, vs. 70% in the U.S. and 45% in the EU. The 15th Five-Year Plan targets 15% EAF by 2025 and 20% by 2030, requiring ~120 TWh of additional clean electricity by 2030. Hydrogen-DRI (direct reduced iron) pilots from HBIS (Zhangjiakou, 1.2 Mt/yr) and Baowu (Zhanjiang) signal a longer-term shift toward green-hydrogen steelmaking.
- Cement: with 2.0 Bt produced annually (~55% of world output), Chinese cement is responsible for ~1.2 Gt CO₂/yr — half from process emissions, half from fuel. Electrification of clinker calcination is technically immature, so the near-term lever is alternative fuels (biomass, RDF) and CCUS pilots (Anhui Conch's 50 kt/yr CCS at Baimashan). Indirect electrification through grinding mills and logistics already consumes ~120 TWh/yr.
- Glass: the float-glass and container-glass sectors together consume ~85 TWh/yr of electricity plus large volumes of natural gas. The first hybrid electric-gas furnace in China (CSG Holding, Hebei, 2024) reaches 80% electrification of the melting step, cutting CO₂ intensity by roughly 60% when run on the projected 2030 grid mix. Photovoltaic-glass production — itself a strategic input to the solar industry — is the fastest-growing sub-segment.
For procurement teams, the implication is concrete: as the grid greens, indirect electrification of these heavy industries becomes the single largest Scope 3 emission-reduction lever for buyers of steel beams, cement, container glass and float glass. A tonne of Chinese rebar produced via EAF on the 2030 grid emits roughly 0.5 t CO₂, against 2.1 t CO₂ for blast-furnace rebar on the 2020 grid — a 75% reduction unlocked almost entirely by switching technology and electricity source, not by changing the molecule.
Cost parity: renewables vs. coal
The economic case is now settled, not aspirational. IRENA's 2024–2025 cost analysis puts the global utility-scale solar PV LCOE at USD 43/MWh and onshore wind at USD 33/MWh — both well below the USD 70–85/MWh range for new coal capacity in China. Domestic Chinese auctions have gone further: solar PPAs at USD 24–32/MWh and onshore wind at USD 26–34/MWh have been signed in 2024–2025 in Inner Mongolia, Gansu and Qinghai.
| Technology (China, 2025) | LCOE USD/MWh | Capacity factor | Notes |
|---|---|---|---|
| Utility-scale solar PV | 24 – 38 | 16 – 22% | Lowest in Western provinces |
| Onshore wind | 26 – 42 | 28 – 36% | Best sites in Inner Mongolia & Xinjiang |
| Offshore wind (fixed) | 55 – 80 | 38 – 45% | Falling 12% per year |
| Solar + 4-h battery | 54 – 72 | n/a | Firmed-up dispatchable output |
| Wind + 4-h battery | 58 – 82 | n/a | Competes with coal baseload |
| New ultra-supercritical coal | 70 – 85 | 55 – 60% | Includes carbon allowance |
| Nuclear (Hualong One) | 65 – 78 | >90% | Long-duration firm capacity |
Three implications follow. First, on a pure marginal-cost basis, no new coal plant in China is now competitive against solar-plus-storage in resource-rich provinces. Second, the 15th Five-Year Plan accelerates this by exposing renewables to merchant markets — which they win on price — while coal increasingly relies on capacity payments rather than energy revenue. Third, the cost curve continues to fall: Chinese-manufactured PV modules dropped from USD 0.22/W in 2022 to USD 0.09/W in late 2024, and lithium-iron-phosphate battery packs from USD 151/kWh to USD 78/kWh over the same period. The competitive pressure on coal is structural, not cyclical.
AI and data centers: a real challenge, a marginal share
Artificial intelligence is now the most-discussed new driver of Chinese electricity demand. Data center installed capacity is set to nearly double from 32 GW at end-2025 to 60 GW in 2030, with electricity consumption climbing from 175 TWh to 316 TWh — a 12% CAGR. AI/HPC workloads will jump from 39% to 48% of total data center capacity over the same period.
Explosive growth in data center capacity
Behind the aggregate numbers, the build pipeline is concentrated in a few mega-projects. The eight national hub regions designated under the 14th and 15th Five-Year Plans (Beijing-Tianjin-Hebei, Yangtze River Delta, Greater Bay Area, Chengdu-Chongqing, Inner Mongolia, Guizhou, Gansu, Ningxia) are absorbing more than 90% of new IT load. Hyperscalers Alibaba Cloud, Tencent, Huawei Cloud and ByteDance accounted for 71% of new capacity additions in 2024, and the average new facility size has grown from 15 MW in 2020 to 78 MW in 2025, with several gigawatt-class campuses now under construction in Hohhot, Wuhu and Ulanqab.
The '80% green' rule
In November 2024, the NDRC and the National Energy Administration jointly issued the 'Implementation Plan for Accelerating the Construction of a Green Computing Power System', which sets a binding floor: any new data center built in a designated national hub region after 1 January 2025 must source at least 80% of its electricity from non-fossil sources by 2030, rising to 100% for new facilities in the Western hubs. Compliance is audited annually via Green Electricity Certificates (GECs) — either bundled with direct power purchase agreements (PPAs) or unbundled from the national green-power exchange.
The rule has three teeth. First, PUE (Power Usage Effectiveness) caps tighten in parallel: 1.25 for new builds in the East, 1.20 in the West. Second, water-usage efficiency (WUE) is now a reportable KPI under the same framework. Third, non-compliant facilities lose eligibility for preferential electricity tariffs and for inclusion in the 'East Data West Computing' compute-allocation quotas — a powerful commercial sanction in a market where 60% of inference workloads are now centrally dispatched.
Yet at the macro level, AI remains a small line item. Translated into primary energy (accounting for thermal losses), AI alone represented around 0.20% of China's total primary energy demand in 2024, and is projected to reach just 0.41–0.59% by 2030 even in aggressive scenarios. Two mechanisms explain this restraint: AI is only a fraction (30 → 48%) of total data center consumption, and the greening of the power mix lowers the conversion factor from electricity to primary energy from ~2.2 today to ~1.8 by 2030.

The IEA's Energy and AI 2025 report goes further: deployed across power grids, industry, buildings and logistics, AI could unlock energy efficiency gains that offset — and potentially exceed — the consumption of the data centers running it. Up to 175 GW of additional transmission capacity could be unlocked on existing lines, 8% of light-industry electricity could be saved by 2035, and grid operations and maintenance could yield USD 110 billion in annual savings globally. For Chinese industrial supply chains, AI is both a load and a lever.
The 'East Data West Computing' strategy
Launched in February 2022 by the NDRC, the Cyberspace Administration of China, the Ministry of Industry and Information Technology and the National Energy Administration, the 'East Data West Computing' (东数西算 / dōng shù xī suàn) strategy is the largest planned re-architecture of digital infrastructure ever attempted. Its premise is geographic: more than 80% of compute demand sits in the energy-constrained coastal East (Beijing, Shanghai, Shenzhen), while more than 80% of low-cost renewable resources sit in the Western provinces (Inner Mongolia, Ningxia, Gansu, Qinghai, Guizhou, Sichuan). Reconciling the two unlocks both lower carbon intensity and lower marginal cost per FLOP.
Operationally, the plan designates 8 national computing hubs and 10 national data center clusters, with the explicit target of relocating 30% of national non-latency-sensitive compute (training, batch analytics, archival, AI fine-tuning) to the Western hubs by 2025 and 50% by 2030. To enable this, the State Grid is investing CNY 380 billion (USD 53 bn) in dedicated computing-power UHV corridors — including the Ningxia–Shanghai 'Algorithm Highway' commissioned in late 2024 — and the China Computing Network (CCN) provides a national orchestration layer that routes workloads to the lowest-carbon available hub in near-real-time.
Flagship projects illustrate the model. Zhongjin's Ulanqab data center is directly connected to 200 MW of wind, 100 MW of solar and 45 MW / 180 MWh of battery storage — one of the country's first zero-carbon computing facilities. China Mobile's Hohhot N+ campus (planned 1.2 GW IT load) has signed a 30-year PPA covering 90% of its electricity from co-located wind and solar. Tencent's Guizhou Gui'an underground data center leverages mountain cooling to push PUE below 1.10. For multinational buyers, this is a structural shift: future Scope 2 footprints of Chinese cloud and AI services will look very different from those of legacy coastal data centers — and contractually, the difference can already be locked in today via Green Power Purchase Agreements traceable on the State Grid's Blockchain GEC registry.
What 2025–2035 looks like
Projections from the IEA, Ember and the 15th Five-Year Plan converge on a clear trajectory: clean energy crosses the symbolic 50% threshold between 2028 and 2030, and by 2035, solar and wind combined overtake coal in absolute production volume.
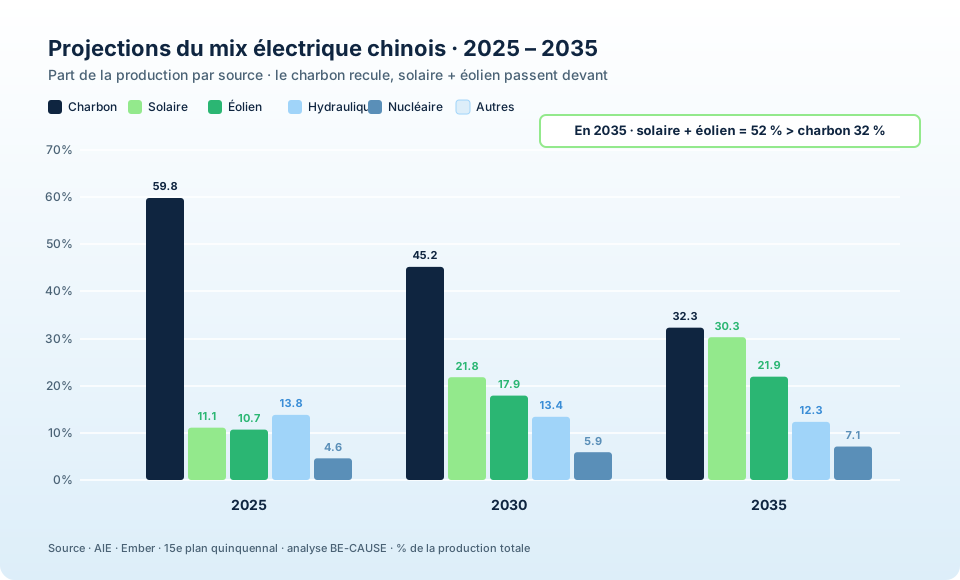
| Indicator | 2025 | 2030 (proj.) | 2035 (proj.) |
|---|---|---|---|
| Total production (TWh) | 10,575 | 12,830 | 15,500 |
| Coal share | 59.8% | 45.2% | 32.3% |
| Solar share | 11.1% | 21.8% | 30.3% |
| Wind share | 10.7% | 17.9% | 21.9% |
| Nuclear share | 4.6% | 5.9% | 7.1% |
| Hydro share | 13.8% | 13.4% | 12.3% |
| Clean energy share | 40.2% | 59.1% | 71.6% |
Nuclear adds a third pillar. With 60 GW operating today and 35 reactors under construction (38 GW), China is targeting 110 GW by 2030, 200 GW by 2040, and 335 GW by 2050 — a pace of roughly one reactor commissioned per month from the mid-2030s onwards. If executed, China overtakes the United States as the world's largest nuclear producer and single-handedly delivers a large share of the global tripling pledge from COP28.
Coal is not dead — it is repurposed
Coal does not disappear in this scenario; it changes function. From baseload, it shifts toward a peaker role, providing flexibility against the intermittency of solar and wind and acting as insurance during extreme weather. This is consistent with the planned national unified power market by 2030, which will allow real-time inter-provincial trading and reward flexibility over rigid dispatch.
Why this matters for global supply chains, CBAM and Scope 3
For any company with a Chinese supplier base, three implications stand out. First, average emission factors are about to fall faster than they ever have — but only for buyers who can prove direct exposure to the cleaner part of the grid. Second, the EU's CBAM does not recognize unbundled green certificates as offsets; the 15th Five-Year Plan therefore promotes Direct Green Power Supply Projects, where exporters invest in near-site renewables with dedicated direct-connect infrastructure. Third, the gap between MEE and IEA emission factors and between spend-based and activity-based Scope 3 calculations will mechanically widen as the mix decarbonizes — making primary, supplier-level data more, not less, important.
China is engaged in the largest energy transition ever undertaken. The numbers are staggering — almost 900 GW of installed solar, over 500 GW of wind, 10,000 TWh of electricity consumed in 2024 — and the trajectory is no longer hypothetical. For procurement, ESG and climate leaders sourcing from China, the practical question is no longer whether the Chinese grid will decarbonize, but how fast each supplier's share of clean electrons can be measured and proven.
“Because ultimately, what can't be measured can't be transformed. And in the race to net-zero, supplier-level energy data is the only compass that points to the real grid.”
— BE-CAUSE.EARTH | Decarbonation Architects
Need to translate China's energy transition into a verified Scope 2 and Scope 3 view of your supply chain? Discover BE-CAUSE's carbon intelligence and ESG consulting services at be-cause.earth.
Questions fréquentes
Références
- Ember. Global Electricity Review 2025.
- International Energy Agency (IEA). Electricity 2025.
- National Energy Administration of China (NEA). 2025 Power Sector Statistics.
- International Energy Agency (IEA). Energy and AI — AI for energy optimisation and innovation. April 2025.
- International Renewable Energy Agency (IRENA). 24/7 renewables now cheaper than fossil fuels. May 2026.
- International Renewable Energy Agency (IRENA). Renewable power generation costs in 2024. July 2025.
- DNV. Energy Transition Outlook 2025: Greater China. October 2025.
- Rystad Energy. China data center analysis. April 2026.
- China Briefing. 15th Five-Year Plan analysis.
- Carbon Brief. China's energy and climate developments. 2024.